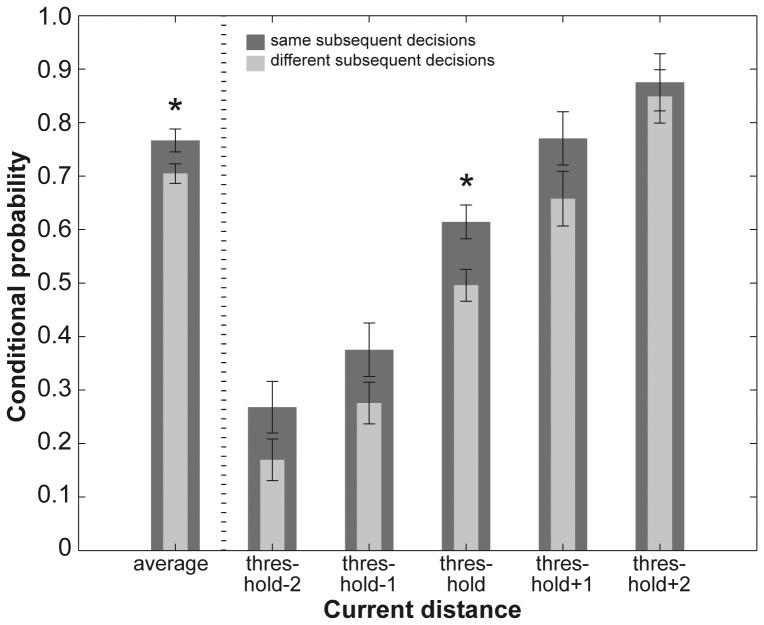
Figure 2. Conditional probabilities for same and different subsequent perceptual decisions.
Bar graphs show conditional probabilities for the decision ‘distance felt’ in combination with either the same (dark gray bars) or a different (light gray bars) decision on the preceding trial. The left panel shows probabilities across all five current and preceding pin distances; the right panel shows probabilities for each of the currently presented pin distances in combination with all other pin distances. Whiskers represent the standard error of the mean. Significant differences between same and different decisions are denoted with a star for p<0.05. See also Table 1.

