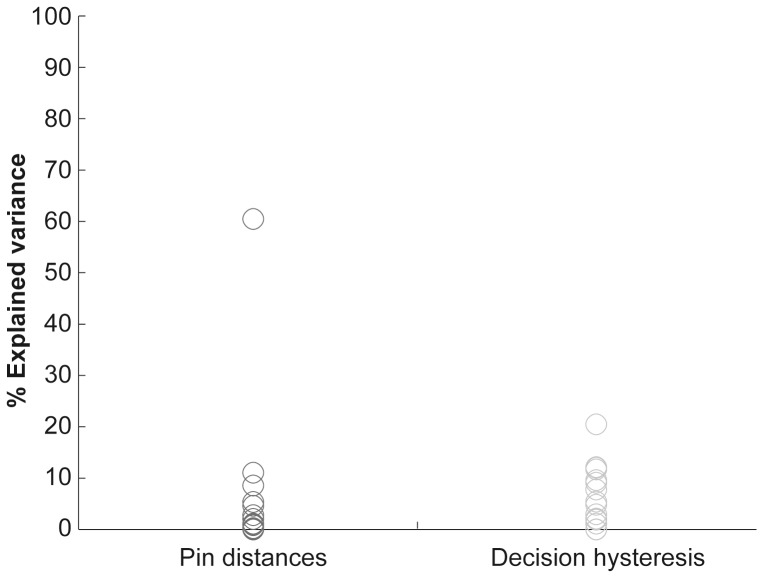
Figure 5. Explained variance of pin distances and decision hysteresis at threshold.
The scatterplot shows explained variance of pin distances (dark gray circles) and decision hysteresis (light gray circles). At threshold we revealed a trend showing that hysteresis explains more variance than the stimulus (i.e., the applied pin distance).

