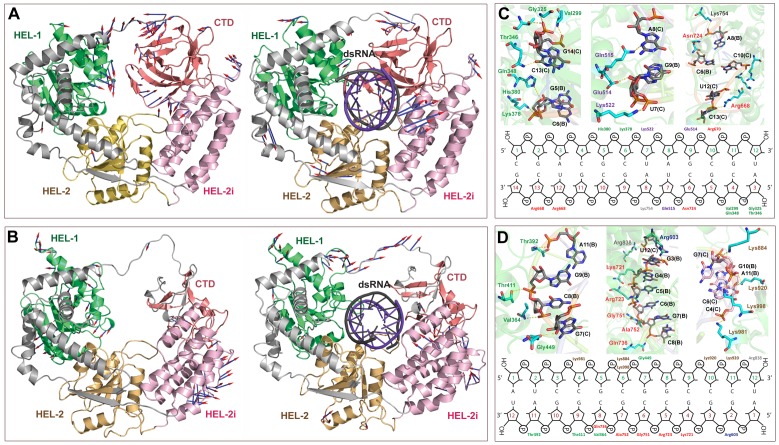
Figure 2. Structural movements of RIG1 and MDA5 receptors during MD simulation.
Porcupine plots showing structural movements of (A) RIG1 and (B) MDA5 receptors during MD simulations. The structural movements are shown for both RNA-bound and free proteins. The docked dsRNA molecule has been colored in violet color. Arrow heads indicate direction of motion and length of the arrows specifies the extent of displacement. The figure also shows the schematic representation of intermolecular interactions (C) RIG1 and (D) MDA5 with dsRNA after MD simulations.

