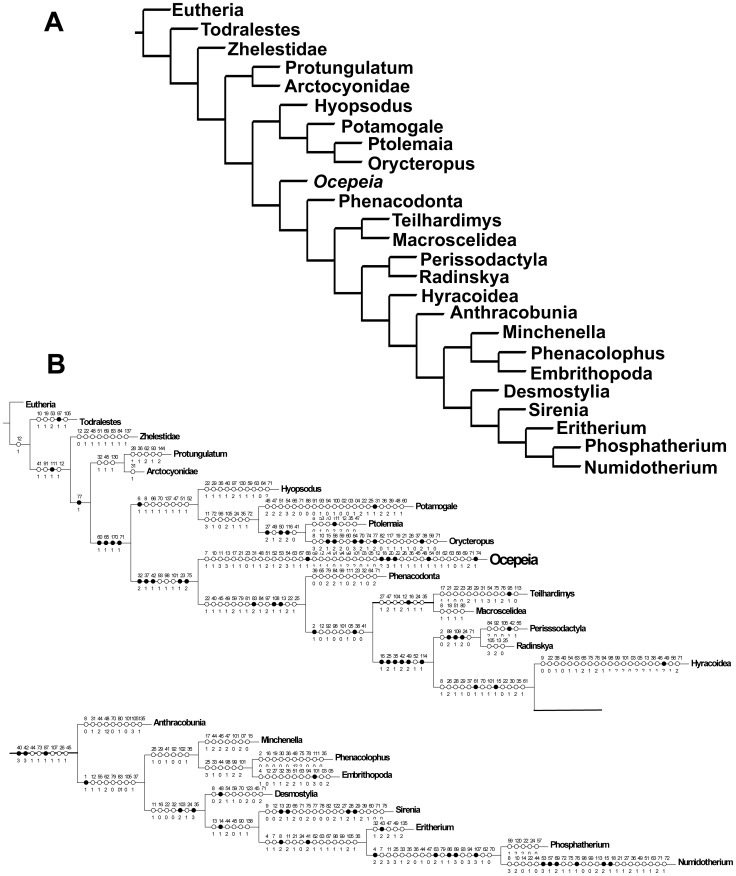
Figure 21. Relationships of Ocepeia.
Cladogram resulting from parsimony analysis with TNT version 1.1 program of modified matrix of Gheerbrant [68] (Text S1, parts I-II). All features are processed as unordered and unweighted in this tree (see Text S1 for character distribution). Single most parsimonious tree obtained from the “traditional search” command (see Text S1, part III, Cladogram 1). Tree length: 596. Retention index: 53.6. Consistency Index: 40.8. In Figure 21b, the black and open white circles represent respectively strict and homoplasic synapomorphies. This is the shortest tree obtained in all our analyses. The implied weighting analysis does not change the topology. In this analysis Ocepeia is by far the most autapomorphic (see text).

