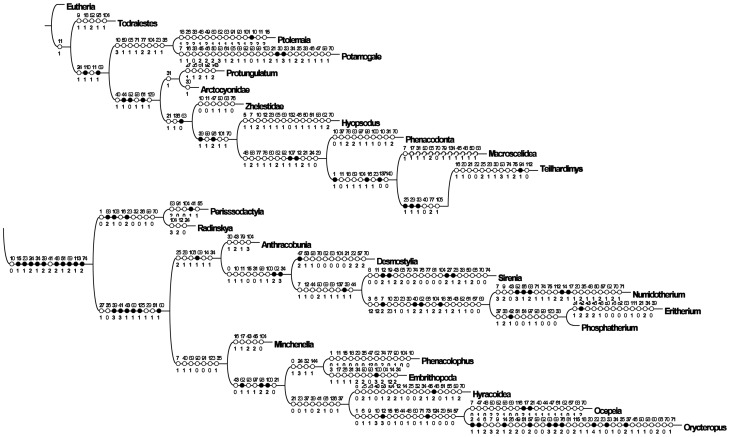
Figure 23. Relationships of Ocepeia.
Cladogram resulting from parsimony analysis with TNT version 1.1 program of modified matrix of Gheerbrant [68] (Text S1, parts I-II). This tree results from an analysis in which Ocepeia is constrained to cluster with paenungulates by increasing the weight of characters shared with paenungulates (Tables 6, 7, 12), i.e., characters 98, 99, 101 that are directly related to the selenodonty. Consensus of two trees (Text S1, part III, Cladogram 13). This tree is well resolved but significantly longer than trees resulting from other analyses (Figs. 21, 22). Tree length: 767; retention index: 53.2; consistency index: 37.5. The black and open white circles represent respectively strict and homoplasic synapomorphies; see Text S1, part III, for description of characters. In this tree Ocepeia is noticeably less autapomophic. See text for further comments.

