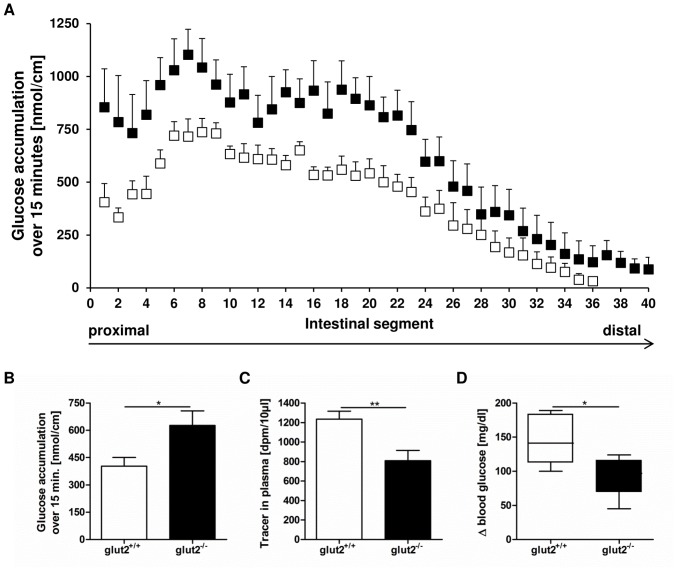
Figure 3. Animals lacking GLUT2 display higher tissue glucose contents but reduced amounts in blood.
Glut2+/+ (white bars) and glut2−/− mice (black bars) were administered an intragastric glucose bolus (4 g/kg) containing radiolabeled D-glucose. After 15 minutes, radiotracer content in intestinal tissue samples covering the whole small intestine, in plasma as well as blood glucose was measured. (A) Tissue radiotracer profile from proximal to distal small intestine in glut2+/+ and glut2−/− animals. (B) Average accumulation of glucose tracer per 1 cm segment over 15 minutes. (C) Plasma tracer contents. (D) Increase in blood glucose levels after glucose load. Values are expressed as mean ± SEM. Statistical analyses were performed using unpaired t-test. * p<0.05, ** p<0.01. N = 5–6 mice per group.

