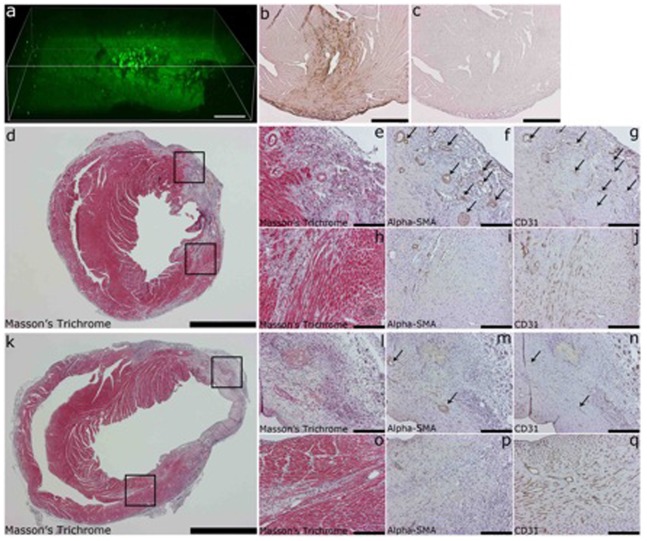
Figure 1. Multiphoton microscopy and histology analysis of myocardial infarction animals.
(a) Multiphoton laser scanning microscopy (MPLSM) analysis of GFP expression in transduced mouse heart, (b) Immunohistological analysis of GFP expression in mouse heart, (c) antibody omitted control, (d and k) Massons Trichrome staining from mouse heart transduced with VEGF-A upregulating LV-451 and shRNA control, respectively, (e and l) insert from infarcted area of d and k, respectively, (h and o) insert from infarct borderzone (f, i, m, p) alpha-SMA staining of smooth muscle cells, arrows point to arteriols formed, (g, j, n, q) CD-31 staining of endothelial cells. Scale bars (a) 100 µm, (d and k) 2000 µm, (e, f, g, h, i, j, l, m, n, o, p, q) 200 µm.

