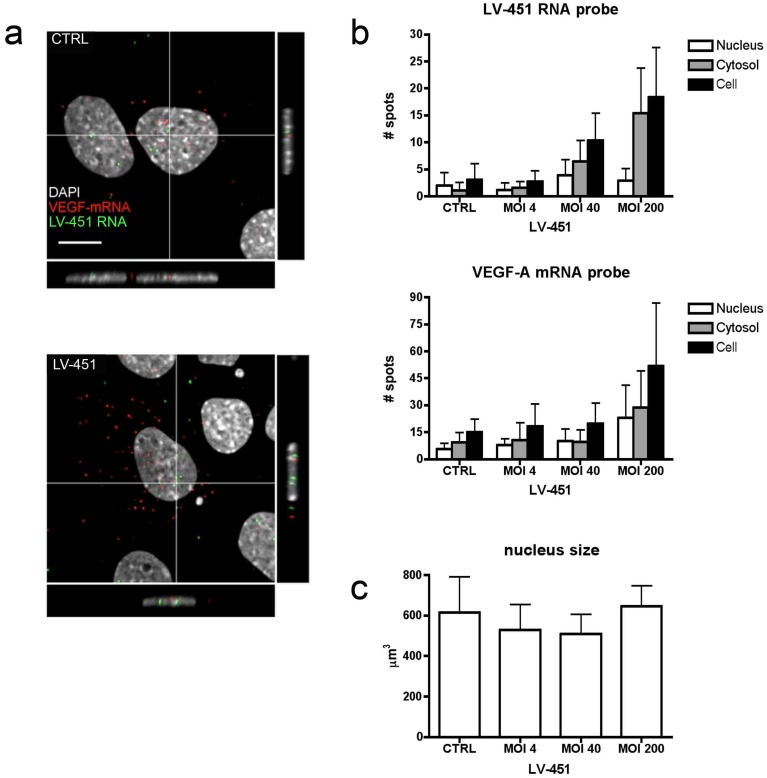
Figure 4. Intracellular distribution of LV-451 expressed RNA and VEGF-A mRNA in transduced cells.
C166 cells were subjected to RNA-FISH analysis with LV-451 or VEGF mRNA probes. (a) Confocal microscopy images of LV-451 transduced (MOI 10) cells 72 h post transduction. Distribution of LV-451 RNA (green) and VEGF-A mRNA (red) probe binding induced signals is shown. Nuclei were visualized with DAPI (grey). Scale bars, 5 µm. (b) Quantification of LV-451 RNA or VEGF-A mRNA RNA-FISH signal spots detected in LV-451 transduced (MOI 4, 40, 200) cells at 72 h post transduction and in nontransduced control cells. The amount of signal was calculated in the nucleus (white), the cytosol (grey) and whole cell (black). Error bars = SD. (c) Nucleus size in response to LV transduction. CTRL sample is nontransduced C166 cells and LV-451 is C166 cells transduced with LV-451 vector.

