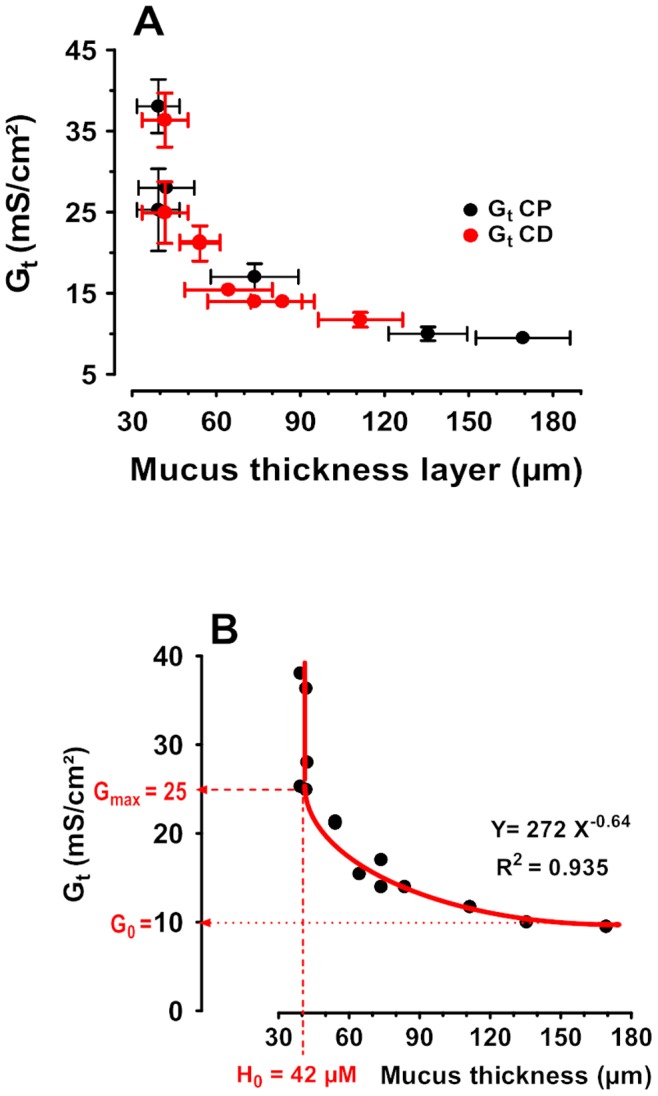
Figure 4. Relationship between Mucus thickness (in µm) and Transepithelial electrical Conductance Gt (in mS/cm2).

The data were obtained from the means of at least n = 13 tissues from 7 rats. Closed black dots indicate proximal colon and closed red dots distal colon (A). The relationship between Gt and mucus thickness (ML) were analyzed by nonlinear regression (curve fit) using the power series equation Y = AXb (B). r2 was 0.94. With 95% confidence limit if of A of 168.6 to 374.6 and B of −0.73 to −0.55, with covariance Matrix A and B = −0.99. Below the threshold of 42 µm the conductance (an index of ionic permeability) remained constant 25 mS/cm2. In contrast, the conductance decreased with mucus thickness down to a limit value of 10 mS/cm2.
