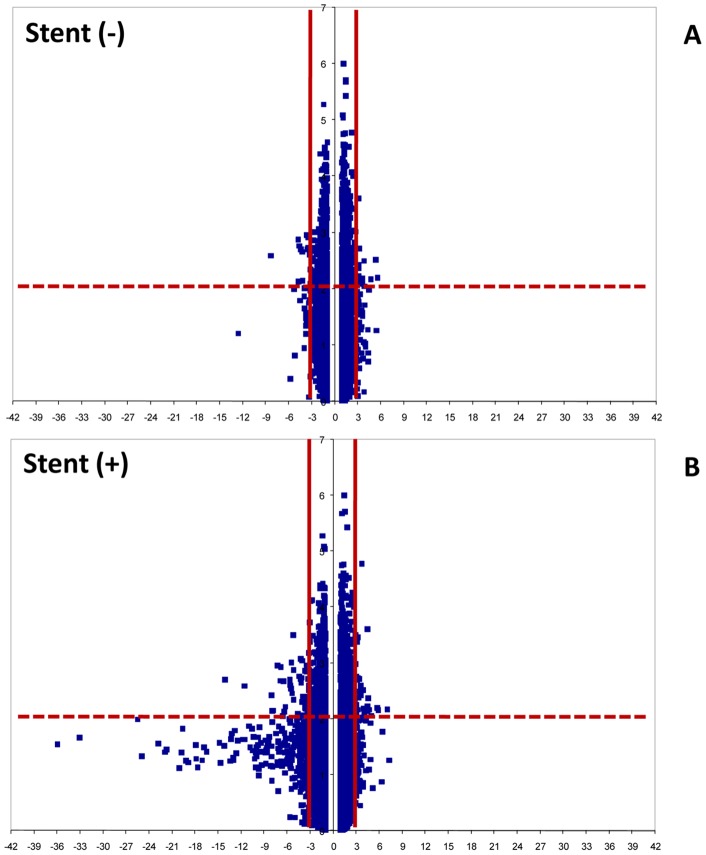
Figure 5. Volcano blots of significance against the fold change of gene expression in different experimental conditions.
A) Genes up and down regulated in 1AS vs 10AS condition. B) Genes up and down regulated in 1PS vs 10PS condition. The fold change was ≥3 in modulus with p values <0.01, determined individually for each gene. Horizontal continuous line indicates negative log of p = 0.01. Vertical dashed lines indicate the fold change cut-off.

