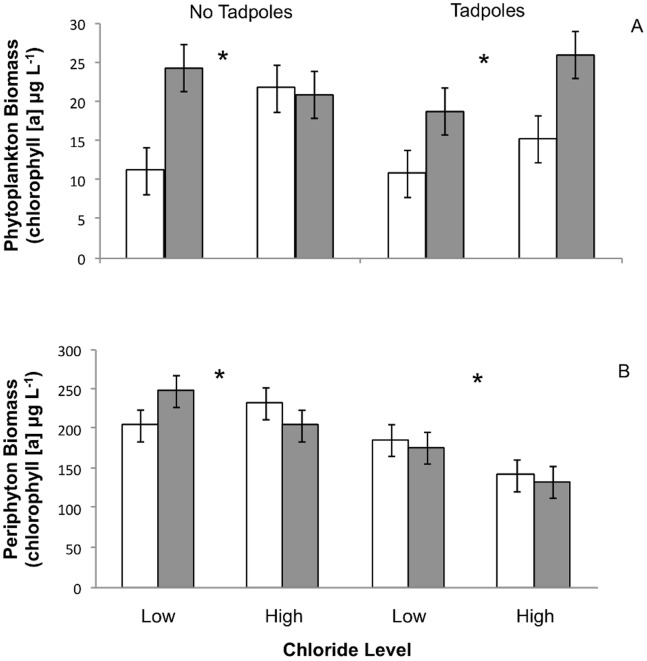
Figure 1. Mean phytoplankton (A) and periphyton (B) biomass (measured as chlorophyll [a] concentration in µg L−1) across chloride (low/high), tadpole (absent/present) and pond inoculum conductance level (low/high) treatments (n = 5 per treatment combination) over the duration of the study.
Open bars represent low pond inoculum conductance levels and shaded bars represent high pond inoculum conductance levels. Asterisks indicate a statistically significant difference (p<0.05) between low and high chloride treatments using RMANOVA. Error bars represent standard error.

