
Figure 2.
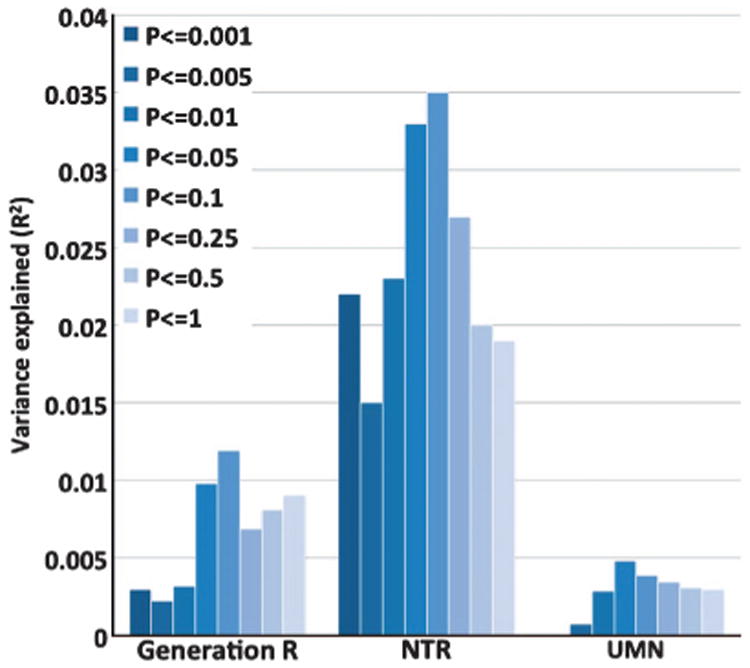
The proportion of the phenotypic variance in childhood intelligence explained by multi-single-nucleotide polymorphisms (SNPs) predictors (R2) in three replication samples. Each bar represents R2 for a given set of multi-SNPs predictors at a given P-value threshold.