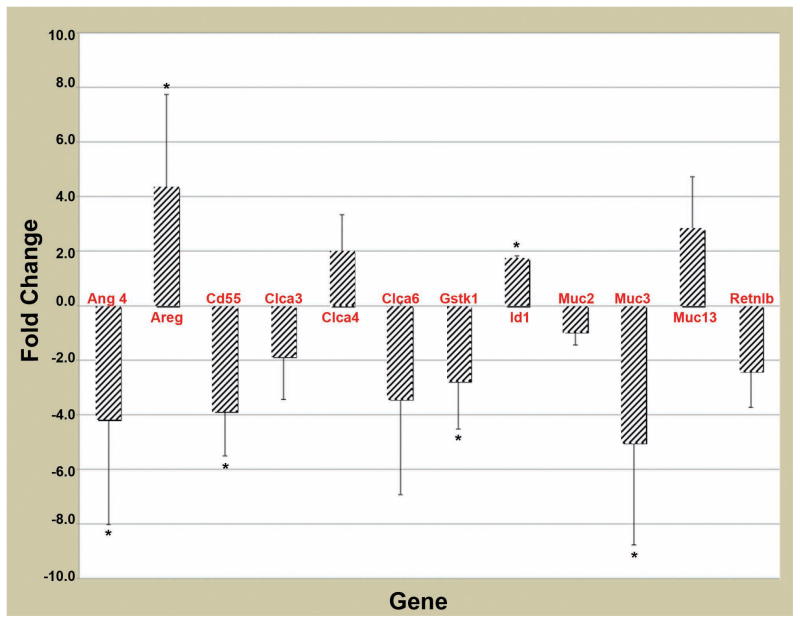
Figure 3. qRT-PCR gene expression analysis of mouse proximal small intestine.
Each gene sample was run in triplicate and gene expression was normalized to the expression of 18S. Data are presented as the mean fold change +/− SD. Each bar represents the mean and standard error of multiple experiments that measured fold differences in the mRNA expression in proximal small intestine tissue isolated from adult (~100 d) littermate and gender matched pairs of Apc+/+ Kcnq1−/− and Kcnq1+/+ mice. mRNAs were isolated from 1 cm sections of proximal small intestine from the same region for all mice. At least two matched pairs of mRNAs were tested for each gene with most genes tested in at least three matched pairs of mRNAs. To be included in this figure genes showed a mean fold difference was at least 1.5. In all cases the direction of changes in gene expression confirmed microarray data. * P<0.05.

