
Figure 4. GSEA.
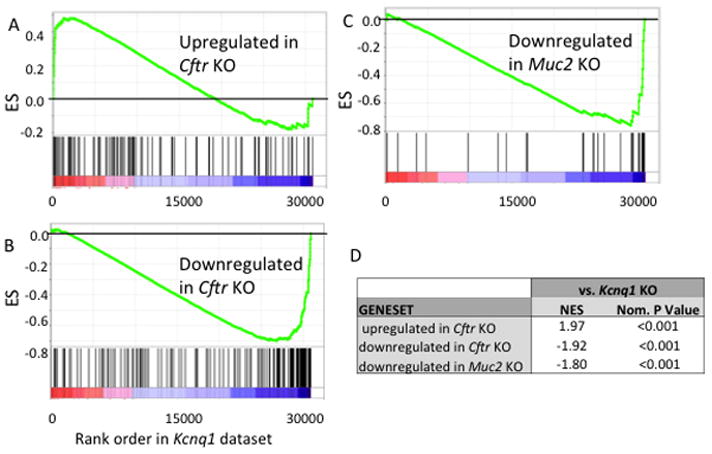
Results of GSEA showing enrichment scores (ES) of Cftr and Muc2 genesets with respect to the ranked Kcnq1 expression dataset. Shown are enrichment plots for genesets consisting of (A) genes upregulated in the small intestine of CFTR KO mice27; (B) genes downregulated in the small intestine of CFTR KO mice27;(C) genes downregulated in the small intestine of Muc2 KO mice37. (D) Normalized enrichment score (NES) and nominal P value (nom. P value) are shown for each comparison.