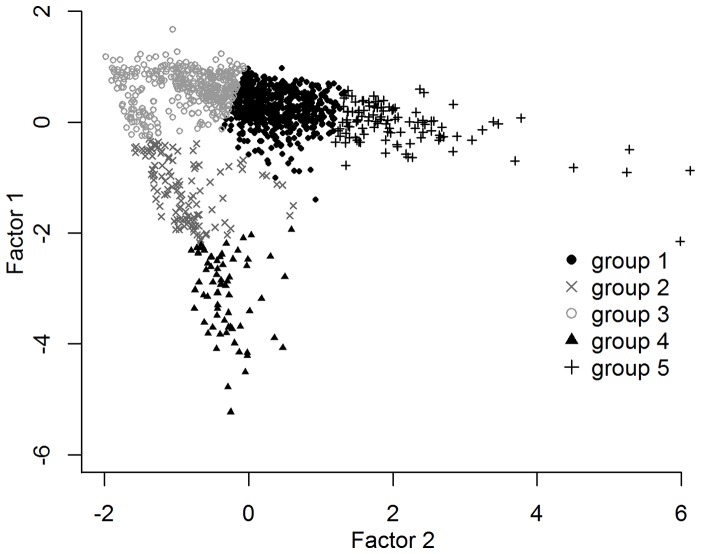
Figure 3. Classification of the PDER events (n = 1268) by the K-means cluster analysis.
The number of groups was set to k = 5 and the temperature variables' means from each group from the complete-linkage hierarchical clustering procedure were used as initial seeds. When compared to the preliminary visual classification, groups 1, 3 and 5 mostly contained PDER events deemed milk ingestions, while groups 2 and 4 were mainly composed of PDER events deemed seawater or solid food ingestions.

