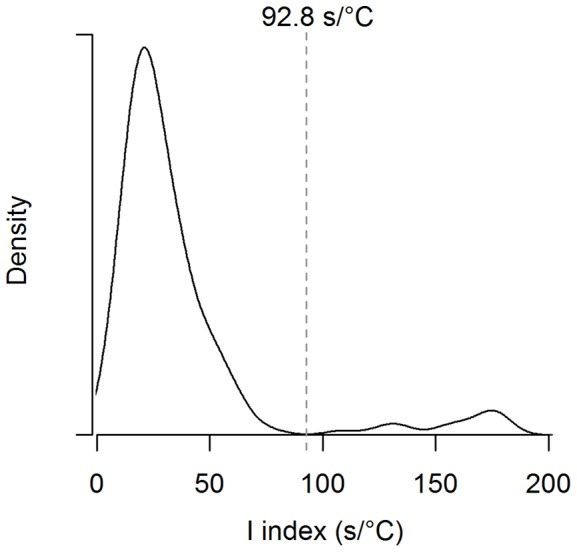
Figure 4. Distribution of the I index of PDER events (n = 190) from groups 2 and 4.

When compared to preliminary visual classification, 98.9% of the PDER events having I index values lower than 92.8 s°C−1 had been deemed seawater ingestions, while 92.3% of the PDER events with I index values greater than 92.8 s°C−1 had been deemed solid food ingestions.
