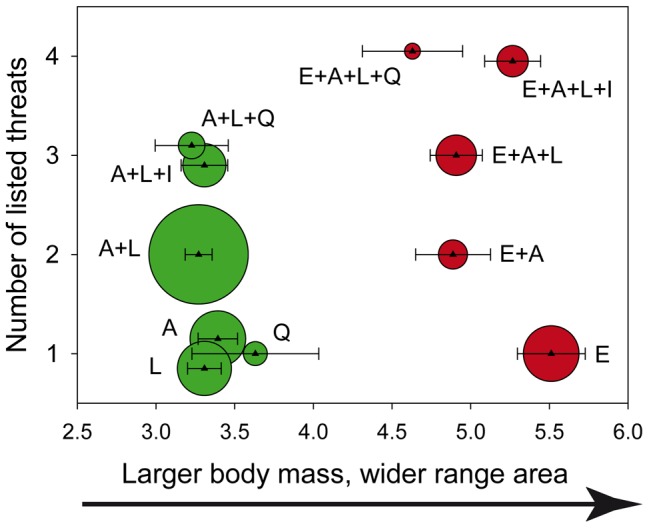
Figure 3. Main threat combinations observed among mammals with distinct numbers of threats.

Each combination is represented by a colored circle with size proportional to the number of species with that combination. For each combination we also plot the mean (small triangle) and the standard error of the mean (error bars) of a PC component representing adult body masses and distribution range areas values. Combinations in the exploitation-habitat loss group are represented by red circles, while those in the habitat loss and degradation group are represented by green circles. Threats are described in Table 1: A = Habitat: agriculture, L = Habitat: logging, E = Direct exploitation, I = Habitat: intense human use, Q = Habitat: quality loss.
