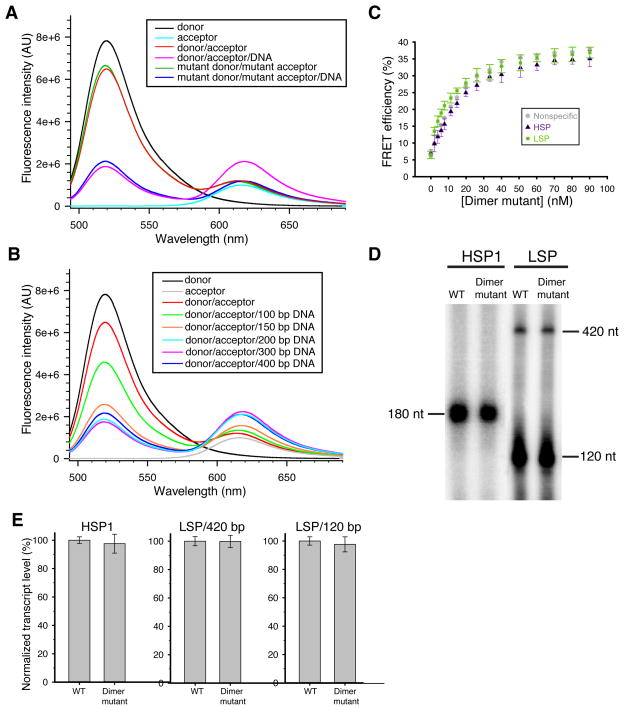
Figure 5. Biochemical analysis of TFAM dimerization.
(A) Emission spectra in a FRET assay measuring the physical interaction between TFAM molecules. Reactions contained Alexa Fluor 488 (donor)-labeled and/or Alexa Fluor 594 (acceptor)-labeled TFAM. Fluorescence emission spectra showed FRET signal only in the presence of plasmid DNA (magenta trace). Note that this signal was abolished in the dimer mutant (blue trace). (B) Emission spectra of wild-type TFAM incubated with linear DNA of varying lengths. (C) DNA bending by the dimer mutant on three templates. Data points are the average of three independent experiments, with error bars representing standard deviations. (D) Representative transcription assay using wild-type TFAM or the dimer mutant. The LSP template generates a 420 nt full-length (run-off) transcript and a truncated 120 nt transcript. (E) Quantification of transcription reactions with error bars representing standard deviations from three independent experiments.

