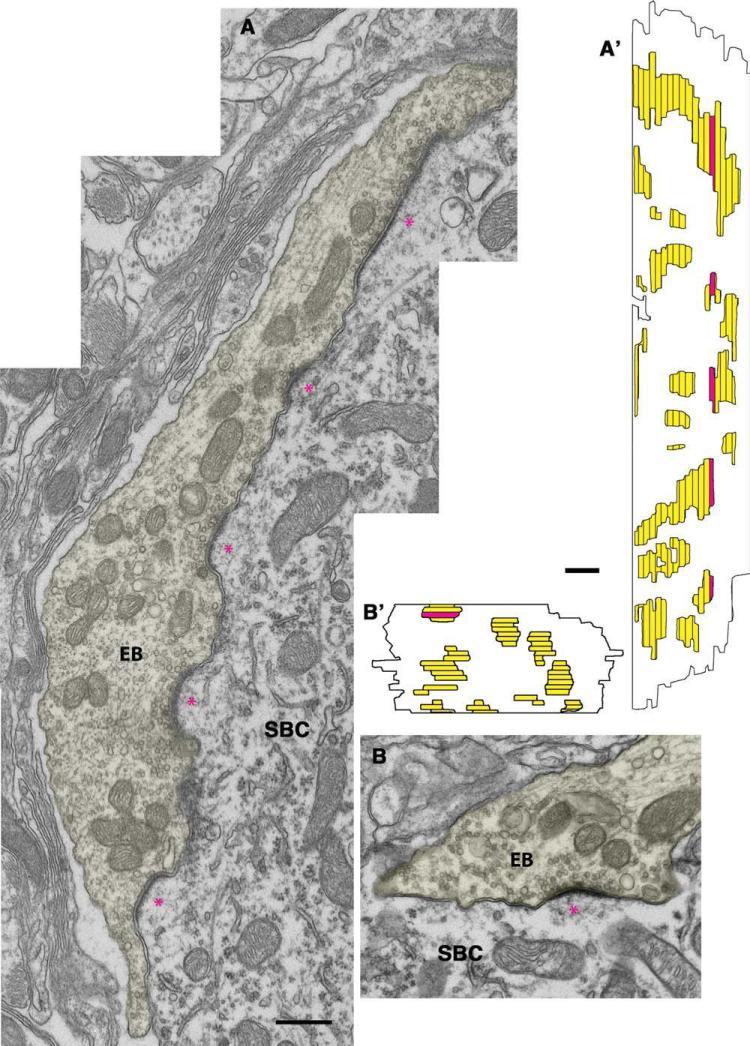
Figure 6.
A,B: Electron micrographs of endbulb of Held (EB) profiles (yellow) contralateral to the cochlear implant placed in 3-month-old congenitally deaf cats. The micrographs are representative of these animals in which the PSDs (*) are partially restored toward their normal appearance. A′,B′: The reconstructed endings illustrate that some of the PSDs are similar to those of congenitally deaf cats without implants, some appear normal, and others are intermediary between those of normal and deaf. The red areas indicate sections of the EB series that are shown in the electron micrographs, and the horizontal lines indicate section edges. SBC, spherical bushy cell. Scale bar = 0.5 μm in A (applies to A,B) and A′ (applies to A′,B′).

