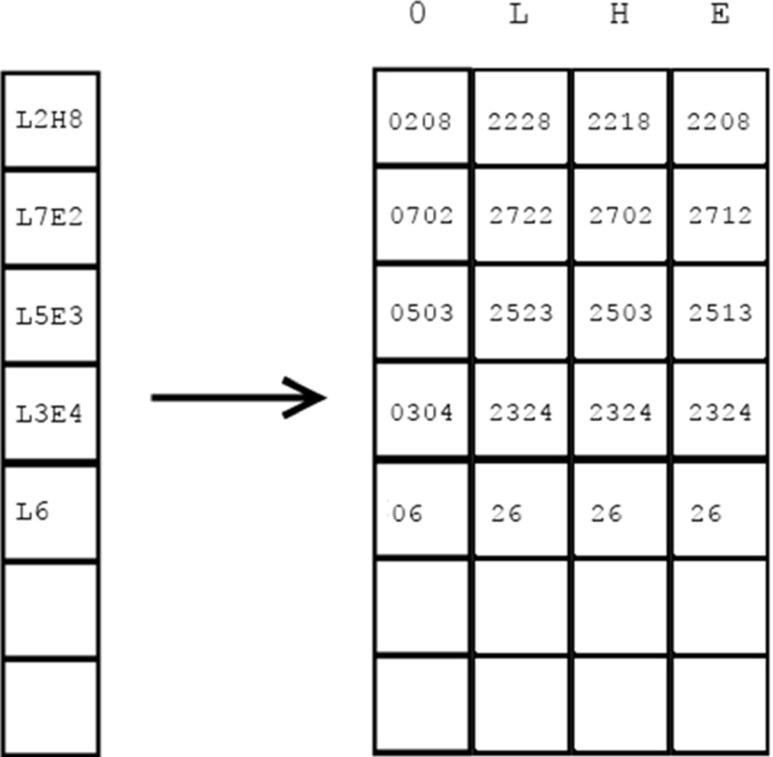
Fig. 8.
Encoding the reduced chain of secondary structure for query protein Q (left) and constructing the query profile (right). The query profile shows all possible (encoded) scores when comparing the reduced query chain of secondary structure to SE regions from candidate protein structures from the database

