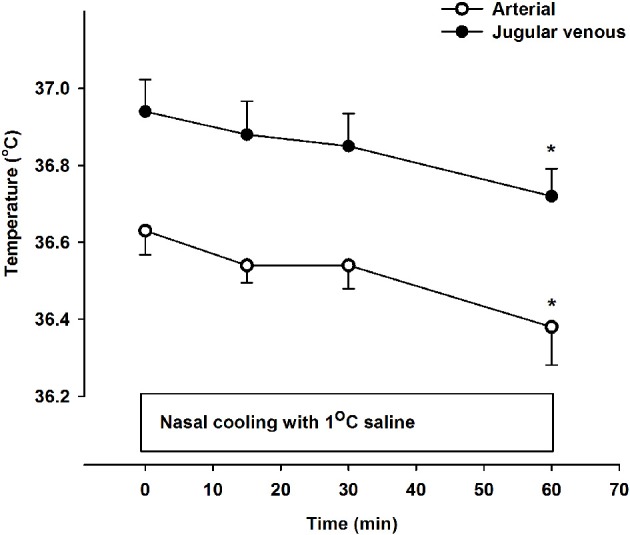
Figure 1.

Arterial (open symbols) and jugular venous blood temperature (filled symbols) at rest (0 min) and during 60 min of nasal cooling with 1°C saline circulated through the nasal catheters at a flow rate of 200 ml/min. *Signifies that the value is lower compared to corresponding value at 0 min (P < 0.05). The jugular venous blood temperature was significantly higher than that of the arterial blood at all time points (P < 0.001).
