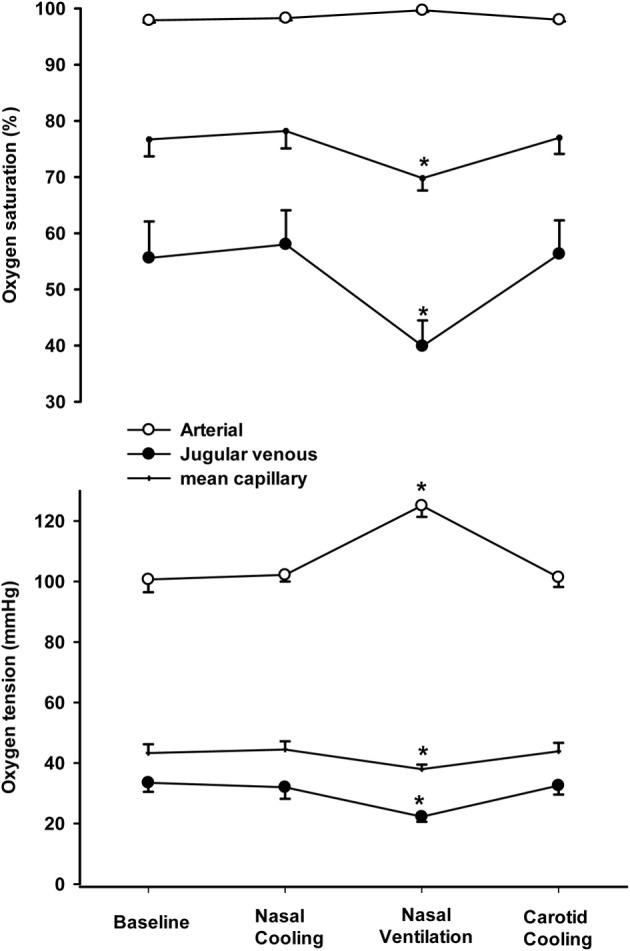
Figure 3.

Arterial, jugular venous and mean capillary oxygen tension (lower panel) and saturation (top panel) at rest (baseline), following 1 h of intranasal cooling, after 5 min of increased nasal ventilation and 15 min of carotid cooling. *Indicates that the value is different from corresponding value at rest (P < 0.05).
