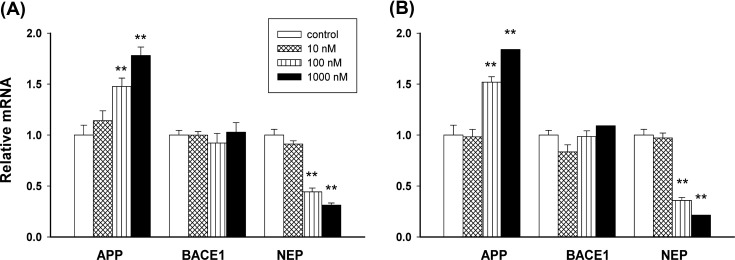
Fig. 2. The mRNA levels of APP, BACE1, and NEP after Hg or MeHg treatment. PC12 cells were cultured with medium only or with various concentrations (10, 100, and 1000 nM) of Hg (A) or MeHg (B) for 48 hr. Data are expressed as mean ± SEM (n = 4). *p < 0.05 vs. control, **p < 0.01 vs. control.