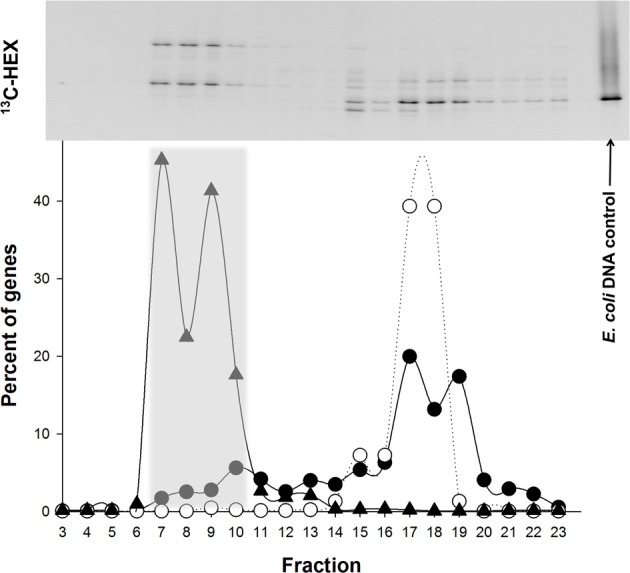
Figure 2.

Distribution of the “heavy” and “light” DNA in separated SIP fractions. (Top) DGGE image of bacterial PCR products from separated [13C]n-hexadecane fractions, with decreasing densities from left to right. The position of unlabeled E. coli DNA, which was used as an internal control in the isopycnic centrifugation, is shown on the right. (Bottom) Distribution of qPCR-quantified 16S rRNA gene sequences is shown below the DGGE image for Alcanivorax (triangles) and Methylophaga (solid circles) in fractions from the [13C]n-hexadecane incubations. The distribution of qPCR-quantified 16S rRNA gene sequences for E. coli is also shown (open circles) in fractions from the 13C incubation. Gene copies in a fraction are presented as a percentage of the total genes quantified in the displayed range of fractions. Data points are aligned with equivalent fractions of the DGGE image.
