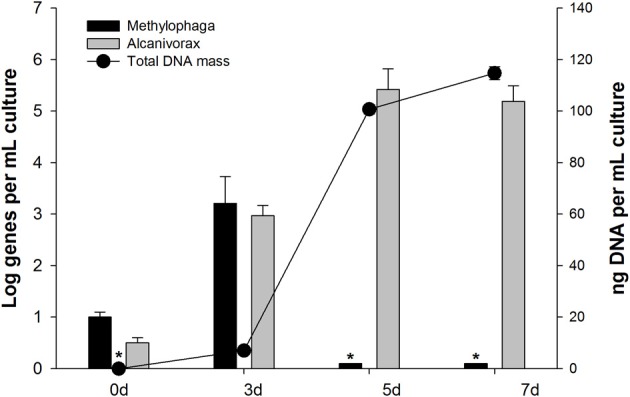
Figure 3.

Abundance of Alcanivorax and Methylophaga 16S rRNA genes during incubation with unlabeled n-hexadecane. Bars are the mean ± standard deviations of results from triplicate qPCRs measuring the abundance of group-specific 16S rRNA genes. Circles are the mean ± standard deviations of triplicate measurements of the total mass of DNA per sample. Bars or data points with asterisks represent numbers with one or more readings below the quantification limit of the assay and are presented as the largest possible value for that point.
