
Figure 2.
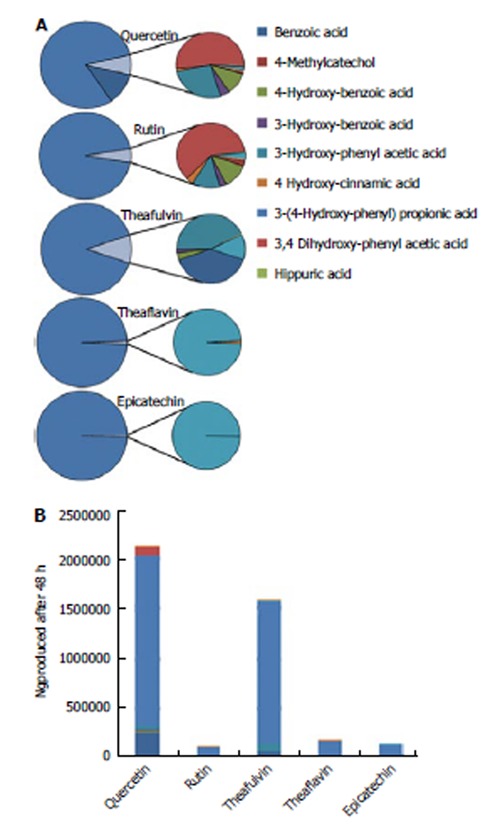
Cumulative production of ‘simple’ phenolic metabolites after 48 h fermentation of different polyphenols in TIM-2. At time zero a single shot of individuals polyphenols (1 microgram in dimethyl sulfoxide) was introduced into TIM-2 throigh the sampling port (Figure 1G). At regular intervals for the next 48 h samples were taken from the lumen and dialysate and analyzed using LC-MS for the microbial metabolites generated by the gut microbiota. The ratio (bar graph, in percentage) and absolute cumulative production (B; in ng) at t = 48 h of microbial metabolites after fermentation in TIM-2 were subsequently calculated and compared amongst the different polyphenols.