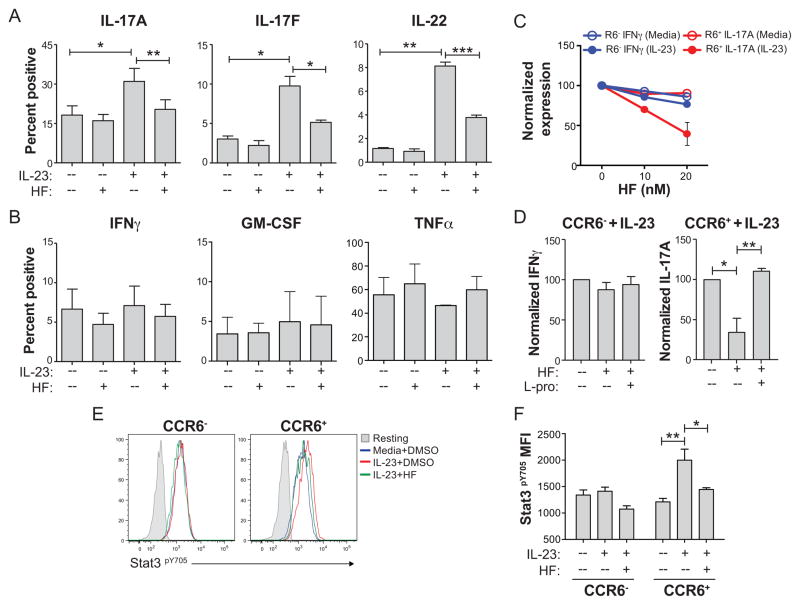
Figure 3. HF regulates IL-23 signaling and downstream cytokine expression in endogenous Th17 cells.
Day 2 cytokine production determined by intracellular staining and FACS analysis in ex vivo-sorted and CD3/CD28-stimulated naïve, CCR6− memory, or CCR6+ memory T cells cultured +/− IL-23 and treated with vehicle (DMSO(or HF (20 nM). Cells were washed to remove HF and restimulated with PMA and ionomycin (P+I) on day 2 for analyses. Mean percentage of IL-17A, IL-17F, and IL-22 (A), or IFNγ, GM-CSF, and TNFα (B) positive cells ± SD from 3–4 biological replicates is shown. * P < .05; ** P < .01; *** P < .001 by paired student’s t test. (C) Dose-response of HF on IL-17A or IFNγ expression by CCR6+ or CCR6− memory T cells, respectively. Mean normalized percentages of cytokine positive cells ± SD from biological duplicates relative to vehicle-treated cultures are shown. IL-23-induced IL-17A expression by CCR6+ cells is shown after subtracting from baseline IL-17A expression in cells stimulated without IL-23. (D) Mean IFNγ expression in CCR6− (left) or IL-17A expression in CCR6+ (right) memory T cells ± SD from 3 independent experiments in cells stimulated with anti-CD3/CD28 plus IL-23 for 2 days +/− 20 nM HF with or without 50 mM L-proline. Controls for HF or L-proline were equal volumes of DMSO or sterile water, respectively. Cytokine expression was determined by intracellular cytokine staining on day 2 following P+I restimulation. * P < .05; ** P < .01 by paired student’s t test. (E) Stat3 (Y705) phosphorylation determined by phospho-specific intracellular staining and FACS analysis in CD3/CD28-stimulated CCR6− (left) or CCR6+ (right) memory T cells cultured for 2 days +/− IL-23 with or without 20 nM HF. Unstimulated cells (no anti-CD3/anti-CD28; Resting – shaded areas) were used to determine background. Data represent 3 experiments. (F) Phospho-Stat3 MFI from 3 experiments ± SD, where background staining in unstimulated cells is subtracted. * P < .05; ** P < .01 by paired student’s t test.

