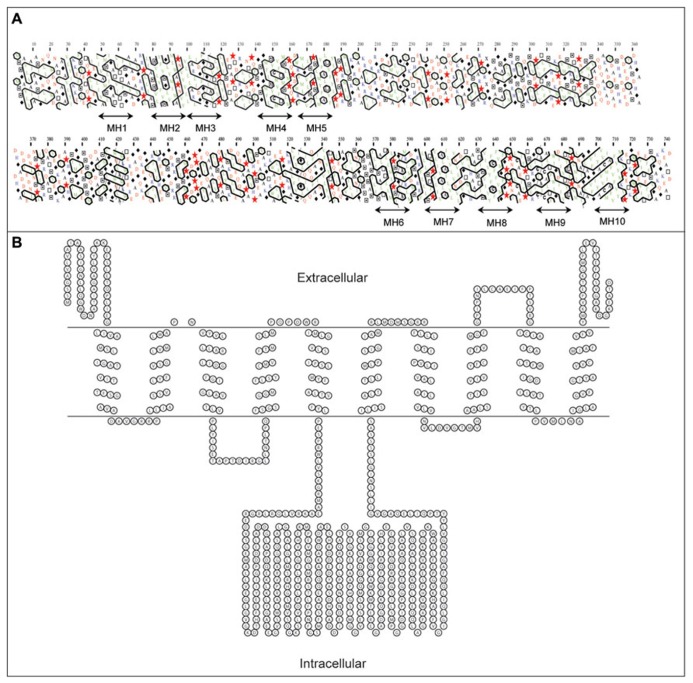
FIGURE 5.
Secondary structure analyses of a barley hexose transporter HvSTP1, (A) A bi-dimensional hydrophobic cluster analysis (HCA) plot (Callebaut et al., 1997). Positions of 10 membrane helices MH1–MH10 are marked by arrowed lines. Proline residues are shown as red stars, glycine residues as black diamonds, serine residues are empty squares and threonine residues are shown as squares containing a black dot in the center. Negatively charged residues are colored in red and positively charged residues are in blue. Other residues are shown by their single amino acid letter codes. The amino acid numbers are read from the top to the bottom of the plots (in duplicate) in a left to right direction. (B) A topology model predicted by PRED-TMR algorithm (Pasquier et al., 1999). The intracellular and extracellular positions of individual domains are shown. The topology map was drawn with TOPO (http://www.sacs.ucsf.edu/TOPO/topo.html).

