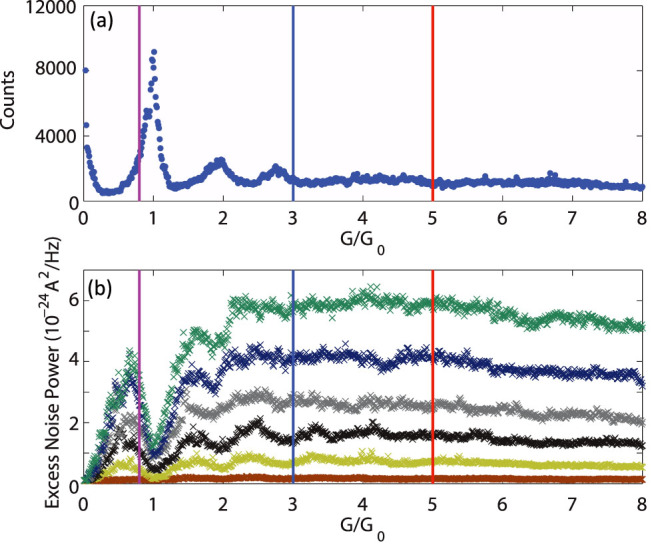
Figure 2.

(a) An example of a typical conductance histogram as well as the noise measurement. The peaks in histogram indicate conductance quantization, coincident with the relative stability of particular junction geometries. In single valence electron materials like gold, this conductance quantization coincides with suppression of the shot noise, indicating that the chemically stable geometries include significant contributions from fully transmitting channels. (b) Excess noise as a function of conductance for a series of bias voltages (from bottom to top, 40, 100, 160, 200, 260, and 320 mV). The vertical lines indicate the particular conductances (purple = 0.8 G0, blue = 3 G0, red = 5 G0) for which noise as a function of bias is plotted in Fig. 3.
