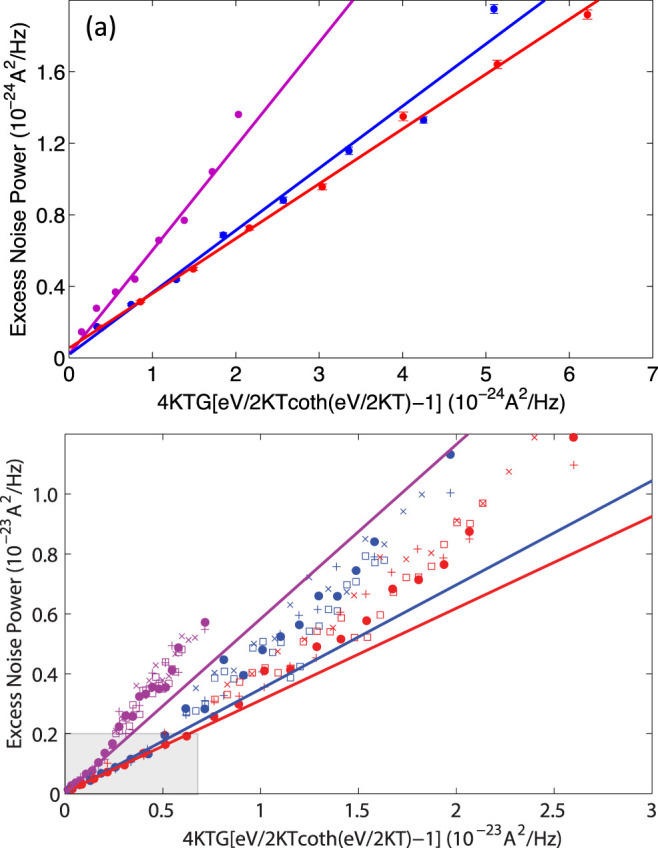
Figure 3. Excess noise power vs the scaled bias at (a) comparatively low bias, and (b) comparatively high bias.

The shaded region in (b) is the domain shown in (a). Colors represent data at different conductances (purple = 0.8 G0, blue = 3 G0, red = 5 G0), as in Fig. 2. The solid lines are corresponding linear fits. Ensemble-average Fano factors at 0.8 G0, 3 G0, and 5 G0 are 0.58, 0.35, and 0.32, respectively. (a) At low biases away from the noise suppressions, the excess noise power is quite linear as a function of the scaled bias, consistent with shot noise as in Eq. (1). (b) At higher biases, significant nonlinearities are present in excess of extrapolations of the low bias linear dependence on the scaled coordinate. Note that independent data sets (acquired after tip cleaning and annealing) plotted in different markers give consistent results for these nonlinearities. The filled circle symbols correspond to the data sets in (a) and in Fig. 2(b).
