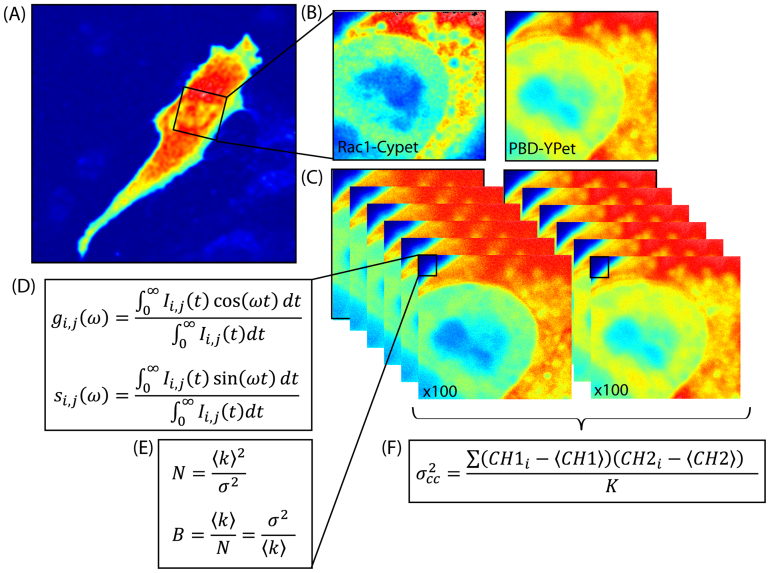
Figure 1. Biosensor FRET detection by concomitant phasor and cross number and brightness (NB) analysis.
(A) Intensity image of a NIH3T3 nucleus transiently transfected with the Rac1 dual chain FLARE biosensor. (B) Intensity image of Rac1-CyPet (donor) and its binding partner PBD-YPet (acceptor) in a selected region within the NIH3T3 cell shown in (A). (C) Time series acquired of the same region as shown in B in the respective channels of Rac1-CyPet and PBD-YPet. (D) In each pixel of the frame acquisition we obtain a time series of the phasor coordinates (gi,j and si,j) with nanosecond resolution, which determines the pixel lifetime and reflects Rac1 activity. (E) In each pixel of the frame acquisition, we also obtain an intensity fluctuation with second resolution, which has a given average intensity (〈k〉) and variance (σ2) that describe the number (N) and brightness (B) of the molecules. (F) By calculating the cross variance in each pixel, we obtain the number of Rac1-CyPet molecules moving together with PBD-YPet.

