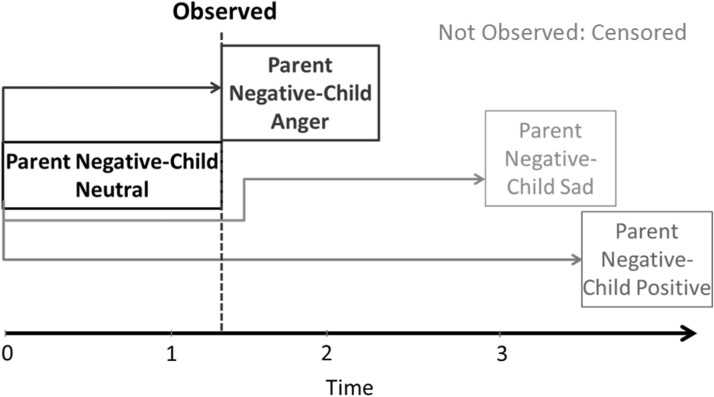
Figure 3.
Schematic diagram of censoring in models of competing risks. What actually happens is the behavior shown at the end of the black arrow, and alternatives that could have happened but did not are shown at the end of the gray arrows; the length of the arrow indicating the waiting time. The behavior with the higher rate will tend to have the shorter waiting time and will censor (dashed black line) the occurrence of the behaviors with the lower rates and longer waiting times.

