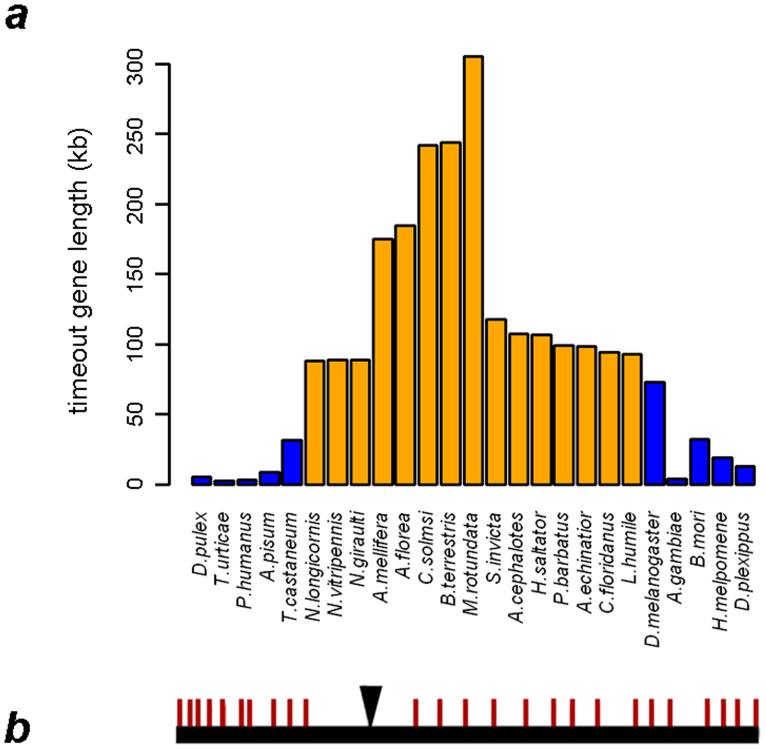
Figure 1. Gene structure analyses on timeout.
(a) Variation of gene lengths among arthropods. The orange columns represent hymenopteran species, and the blue columns represent non-hymenopteran species. (b) The genomic structure of timeout in Ceratosolen solmsi. The red bars represent exons, and the black reversed triangle denotes the nested gene, putatively encoding an insulin growing banding protein.

