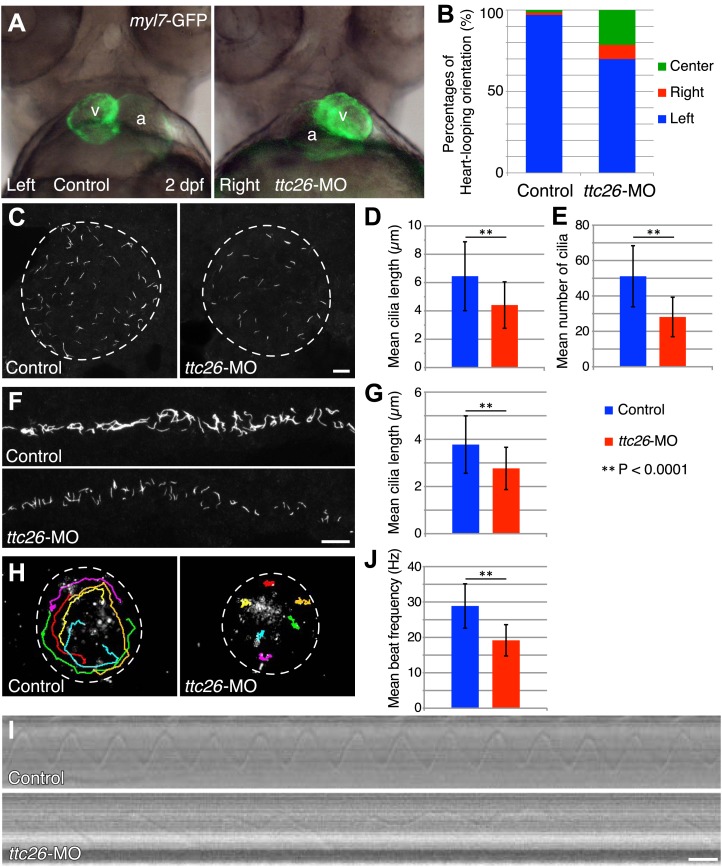
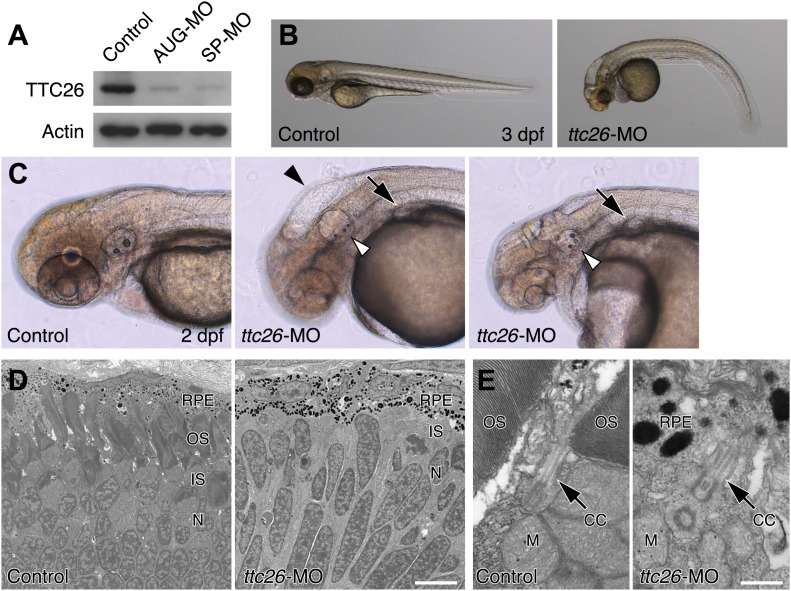
Figure 2. Knockdown of ttc26 in zebrafish induces shorter cilia and motility defect.
(A) Representative images of heart-looping orientations of control (Left: normal) and ttc26 knockdown (Right: reversed) fish at 2 dpf. myl7-GFP transgenic embryos were injected with control or ttc26 morpholinos. Atrium and ventricle are indicated by the letters a and v. (B) Percentages of heart-looping orientation of control (n = 338) and ttc26 (n = 309) knockdown fish. Around 97% of control morphants showed normal heart-looping orientations (left: blue). In contrast, more than 30% of ttc26 morphants showed abnormal heart-looping orientations (right: red and center: green). (C) Immunofluorescence images of Kupffer’s vesicle in control and ttc26 knockdown embryos, which were stained with antibodies to acetylated tubulin at 10-somite stage. Dashed line shows boundary of KV. Bar: 10 μm. (D) Length of KV cilia in control (n = 920) and ttc26 knockdown fish (n = 506, p<1 × 10−69). Blue shows control and red shows ttc26 knockdown embryo. Error bars represent standard deviations in all figures. (E) Number of KV cilia in control (blue, n = 18) and ttc26 knockdown fish (red, n = 18, p<1 × 10⁻⁴). (F) Immunofluorescence images of pronephric ducts that were stained with antibodies to acetylated tubulin at the 22-somite stage. Bar: 10 μm. (G) Length of pronephric duct cilia in control (n = 103) and ttc26 knockdown fish (n = 75, p<1 × 10⁻⁸). (H) The traces of fluorescent beads in KV in control and ttc26 knockdown embryos at the 8-somite stage showing impaired fluid flow in the morphant. Six representative tracks are shown in different colors in each image. These tracks were traced from the first 50 frames of Videos 1 and 2. (I) Kymographs of individual KV cilia in control and ttc26 knockdown embryos. These kymographs were assembled from Videos 3 and 4. Bar: 20 ms. (J) Beat frequency of KV cilia in control (blue, n = 38) and ttc26 knockdown fish (red, n = 21, p<1 × 10⁻⁸). Error bars show standard deviations.


