Figure 2.
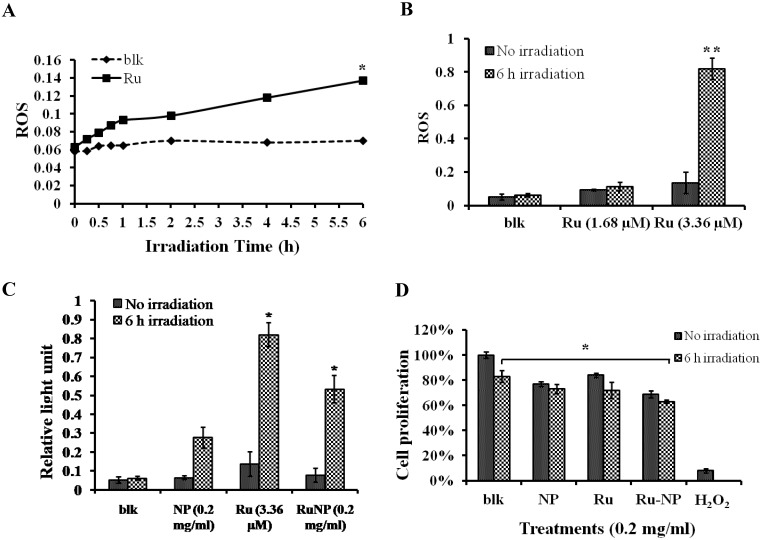
RuBpy induced ROS in living cells. The cells were irradiated for 6 h. The cells treated with PBS buffer were irradiated as a control. (A) MH-S cells were treated with RuBpy for 2 h, and irradiated for various time periods. ROS signals at different irradiation time periods were detected with the NBT assay. (B) Different concentrations of RuBpy2+ induced ROS (1.68 µM =0.1 mg/mL, 3.36 µM = 0.2 mg/mL) determined by H2DCF-DA method. (C) Rubpy2+ doped NPs induced ROS in MH-S cells. 0.2 mg/mL RuBpy-doped NPs or the control NPs (same size but without doped dye) were used to treat the MH-S cells for 2 h. Cells treated with PBS used as control. After the NP treatment, cells were subjected to 6 h irradiation. ROS levels were measured by NBT assay. (D) Effects of NPs, RuBpy and RuBpy-NPs on cell viability in MH-S cells as measured by MTT assay. The data are presented as means±SEM and are representative of three experiments (one-way ANOVA (Tukey's post hoc); * p < 0.05; ** p < 0.01).

