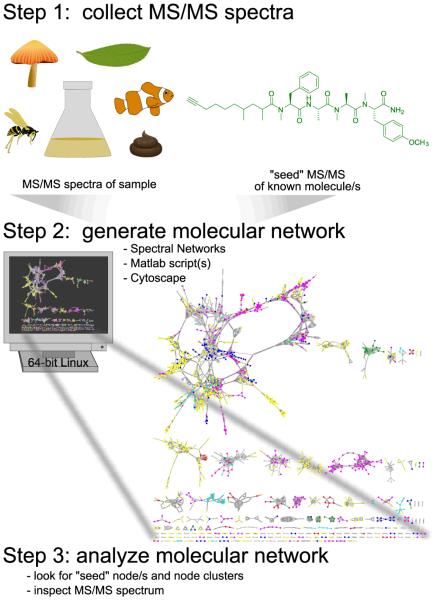
Figure 1. Three steps to implement molecular networking for dereplication.
Experimental MS/MS spectra of samples, which can be of a high degree of complexity and heterogeneity, and MS/MS spectra of known molecules, dubbed “seed” spectra, are analyzed on a 64-bit Linux system. The resultant network is visualized in Cytoscape where one node represents one consensus MS/MS spectrum and is labeled with the precursor mass, and an edge represents relatedness, where edge thickness indicates cosine similarity.

