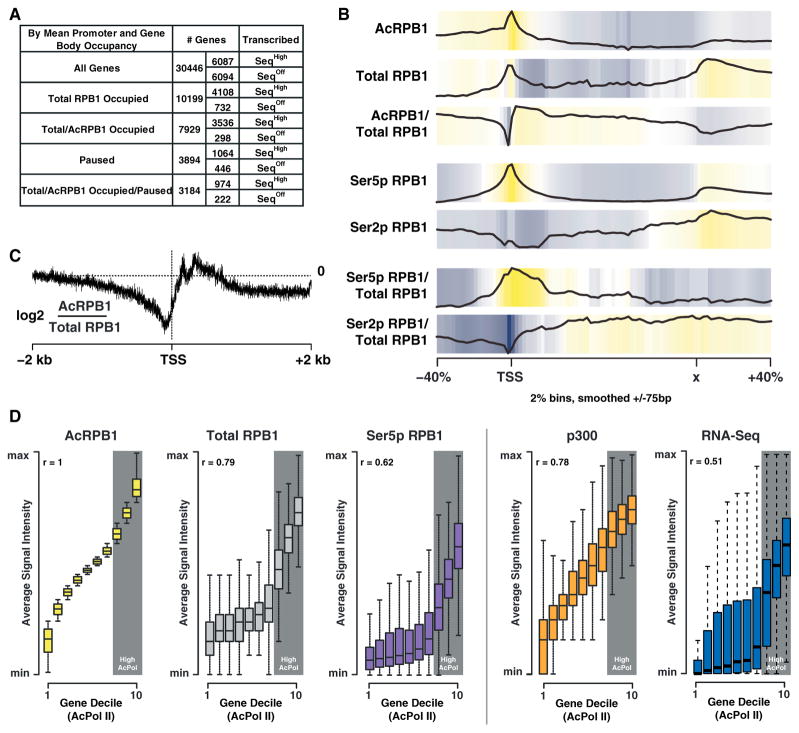
Figure 4. K7 Acetylation Is Enriched Downstream of the Transcription Start Site.
(A) Table showing the number of genes occupied by total and acetylated RPB1 as well as the pausing and expression state of the occupied genes (pausing index cutoff = 3).
(B) Input normalized average gene occupancies of the indicated RPB1 isoforms as well as their relative enrichment over total RPB1 plotted from −40% to +40% of the length normalized genes. The locations of the TSS as well as the termination site (x) are indicated.
(C) Plot of the relative acetylated/total RPB1 occupancy anchored at the TSS. Acetylated RPB1 enrichment is shown for a range of ± 2 kb of the TSS in log2 space at a single base resolution.
(D) Plots of gene deciles ranked (1–10) by acetylated RPB1 levels (left) within ±1 kb of the TSS. The occupancy levels for total RPB1, Ser5p RPB1, p300 (GEO accession number GSM918750), and RNA-Seq (GEO accession number GSM929718) ±1 kb of the TSS for each gene decile, as well as the genome-wide correlation (r) of these marks with acetylated RPB1, are shown on the right. The ranges are calculated by the default boxplot function in R, with the box describing the interquartile range (IQR) of the data, which contains the central 50% of data points. The whiskers extend to the furthest outlier from the edge of the box or 1.5 times the width of the IQR.

