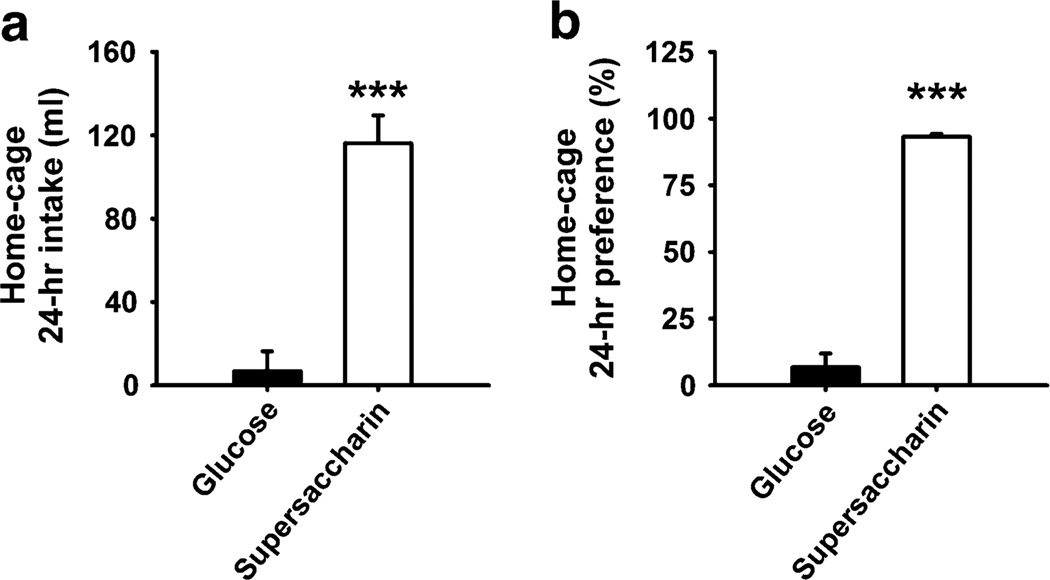
Fig. 1.
Twenty-four-hour preference test in male Wistar rats (n=8) provided in the home cages with two bottles containing the supersaccharin solution (1.5% w/v glucose and 0.4% w/v saccharin) and the glucose solution (1.5% w/v glucose). Panels show M±SEM of a intake and b preference, calculated as the % of total intake. ***p<0.001, difference from glucose (paired Student’s t tests)

