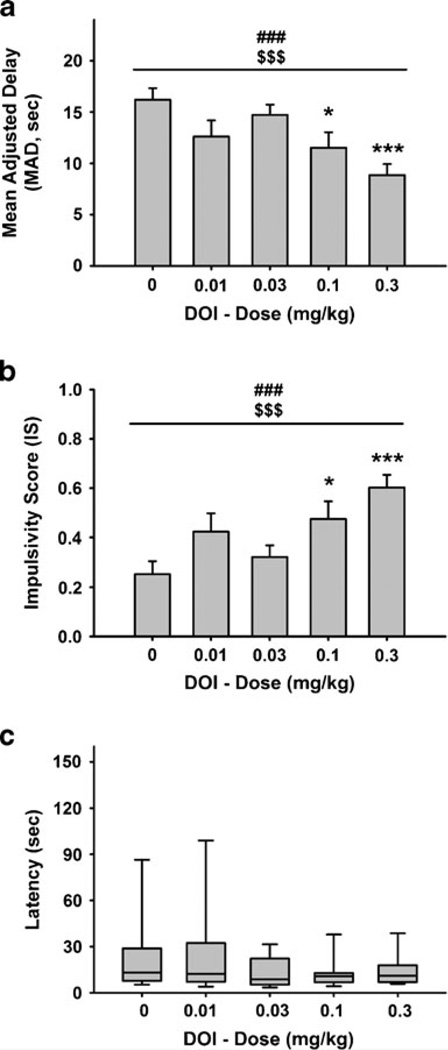
Fig. 3.
Effect of pretreatment with DOI (n=12) (s.c., 15 min prior to the beginning of the first block of the session) on a mean adjusted delay (MAD) and b impulsivity score (IS), in male Wistar rats. a, b M ±SEM. c Box and whisker plots of latency where the boundaries indicate the 25th and 75th percentiles, the line within the box marks the median, and the whiskers (error bars) indicate the 90th and 10th percentiles. Symbols denote significant differences from vehicle: *p<0.05, ***p<0.001 (Newman–Keuls test or Dunn’s test); significant main effect of dose ###p<0.001, significant linear trend of dose, $$$p<0.001

