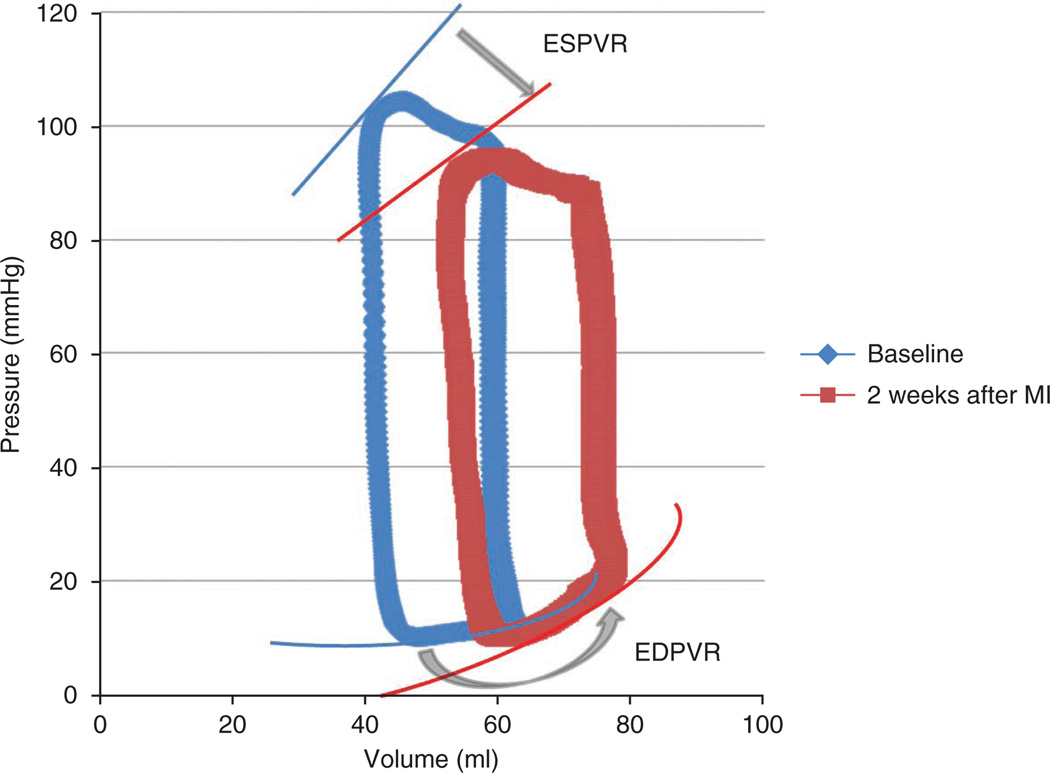
Figure 11.
Representative pressure-volume loops before and after MI model creation. Representative pressure-volume loops demonstrating pathological changes from baseline to 2 weeks after MI. The decrease in the slope of the end systolic pressure-volume relationship (ESPVR) curve (straight arrow) indicates considerable contractility impairment, and the steeper slope of the end diastolic pressure-volume relationship (EDPVR) curve (curved arrow) reflects the increase in ventricular stiffness.

