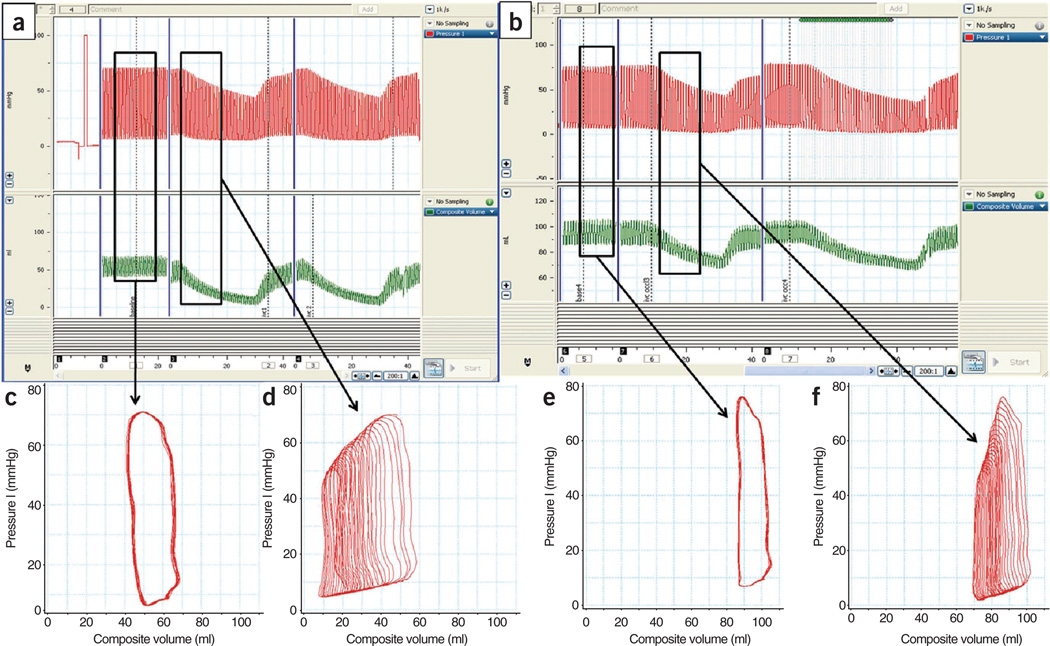
Figure 7.
I Pressure-volume data obtained using a micromanometer conductance catheter. (a–f) Characteristic changes (a,b) in porcine LV pressure (red trace) and volume (green trace) from steady state (c,e) to various changes in preloads (d,f). Panels a,c and d show pressure-volume relationships at the baseline, whereas panels b,e and f show the corresponding relationships 2 weeks after MI.

