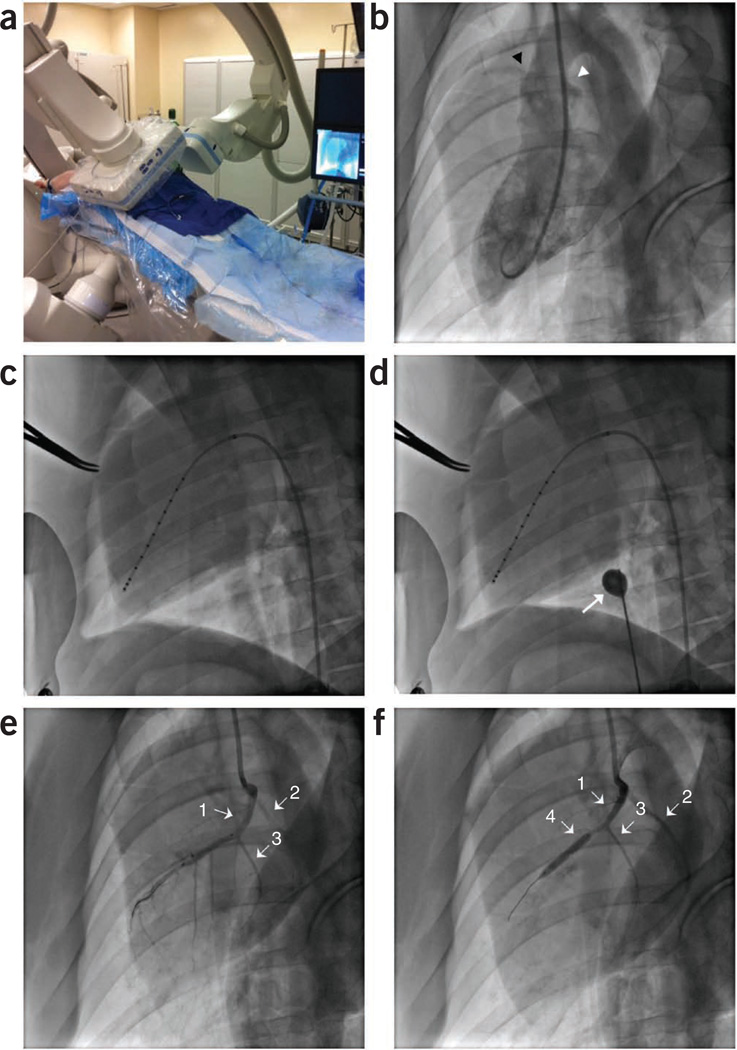
Figure 8.
Cardiac fluoroscopic and angiographic imaging depicting placement of diagnostic catheters and induction of MI. MI model. (a) Swine placed dorsally recumbent under biplane angiography. Vascular access is shown through the right carotid artery and the right external jugular vein. (b) Left ventriculogram (right anterior oblique 30° view) showing the right and left coronary ostia, as highlighted by the black and white arrowheads, respectively. (c) Pressure-volume conductance catheter properly placed along the long axis of the left ventricle. (d) Balloon occlusion catheter (white arrow) inflated to decrease preload on heart during pressure-volume loop data collection. (e) Left coronary angiogram showing the LAD (arrow 1), LCX (arrow 2) and the first diagonal branch of the LAD (arrow 3). (f) Left coronary angiogram showing the LAD (arrow 1), LCX (arrow 2), and the first diagonal branch of the LAD (arrow 3) and the PTCA balloon obstructing all distal flow of the LAD past the first diagonal (arrow 4).

