
Figure 4. Interrelationship of reactive fibrosis, resistin expression and resistin action in cardiac haemodynamic and neurohormonal stress.
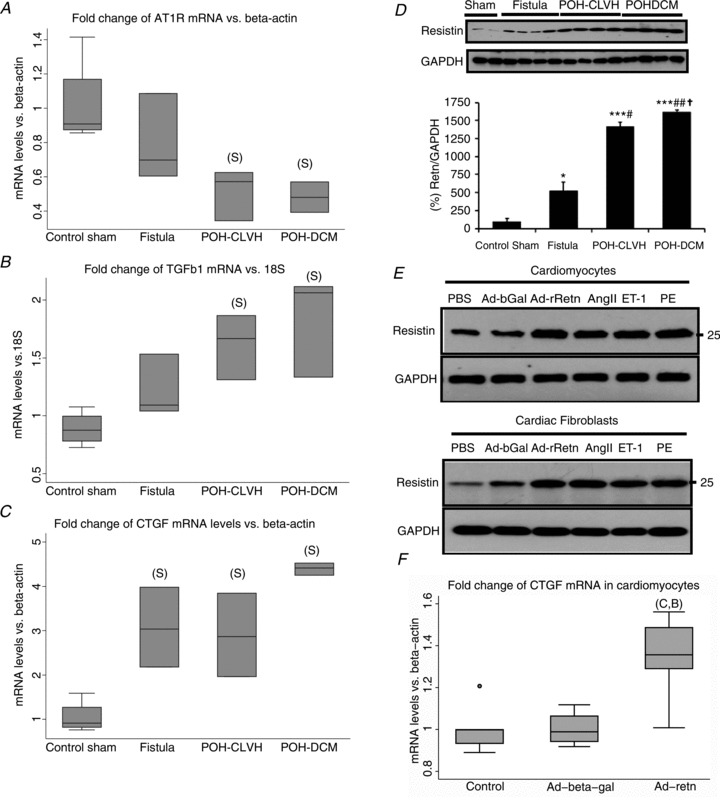
A, AT1R mRNA is significantly downregulated in POH; P= 0.01 for ANOVA on ΔΔCt; ‘S’, significant vs. Sham by Tukey test; n= 3–4 animals per group. B, TGFβ1 mRNA expression; P= 0.005 by ANOVA. C, CTGF mRNA expression; P= 0.0004 by ANOVA. D, resistin protein levels are markedly elevated in POH and mildly elevated in VOH. Mean ± SEM, by t test: *P < 0.05 vs. Sham, ***P < 0.001 vs. Sham, #P < 0.05 vs. Fistula, ##P < 0.01 vs. Fistula, †P < 0.05 vs. POH-CLVH, n= 2–4 per group. E, resistin expression in adult rat cardiomyocytes and cardiac fibroblasts is induced by neurohormonal stress. Ad-bGal, adenovirus overexpressing β-galactosidase; Ad-rRetn, adenovirus overexpressing rat resistin; AngII, angiotensin II; ET-1, endothelin 1; PE, phenylephrine; PBS, phosphate-buffered saline. F, CTGF mRNA expression in adult rat cardiomyocytes infected with adenovirus (Ad) expressing resistin. P= 0.0094 for ANOVA on ΔΔCt; Ad-resistin is significantly higher than Ad-β-galactosidase ‘B’ and control ‘C’ by Tukey test; n= 4–5 samples per group.