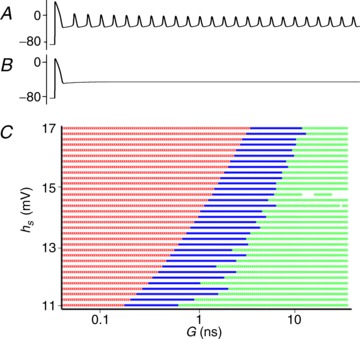
Figure 5. Simulation results from the two-cell Pasek et al. (2008) model.

A, shift in the Na+ inactivation gate (h) curve (hs > 11 mV) results in sustained EADs. B, EADs are suppressed when two cells are coupled for some values of conductance (G) and hs. C, two-cell simulations where a quiescent cell (hs= 0 mV) is coupled to a EAD expressing cell (hs > 11 mV) for 6000 different values of G and hs. The results are classified as blocked (no EADs – green), suppressed (elevated baseline with no oscillations – blue), and expressed EADs (red). EADs, early afterdepolarizations.
