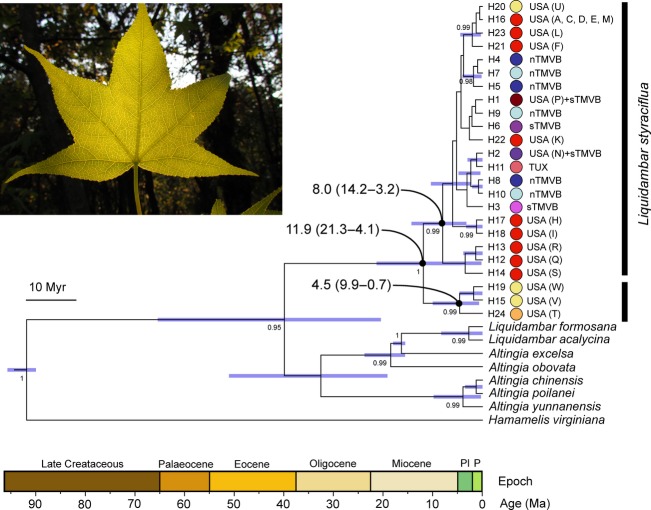
Figure 4.
Chronogram of Liquidambar styraciflua haplotypes and other Altingiaceae based on the consensus tree from the Bayesian dating analysis using a coalescent model with constant size and the psbA-trnH/psbE-petL combined dataset. For selected nodes, 95% Highest Posterior Density (HPD) intervals, indicated here by purple bars, and other inferred divergence estimates comparing different approaches are further summarized (in MYA) in the Results section. These nodes all have posterior probabilities of 0.95–1.0. The root of the tree was calibrated using Microaltingia Zhou, Crepet et Nixon (Zhou et al. 2001) from the Late Cretaceous of New Jersey. Ages in geological time are shown at the base of the tree. Color coding indicates major clusters of interest, and haplotype numbers are used in Fig. S1, which shows the statistical parsimony haplotype network and the geographic distribution of Liquidambar styraciflua cpDNA haplotypes in Mexico and the USA. Haplotype codes in parentheses (K–W) correspond to those in Morris et al. (2008).

