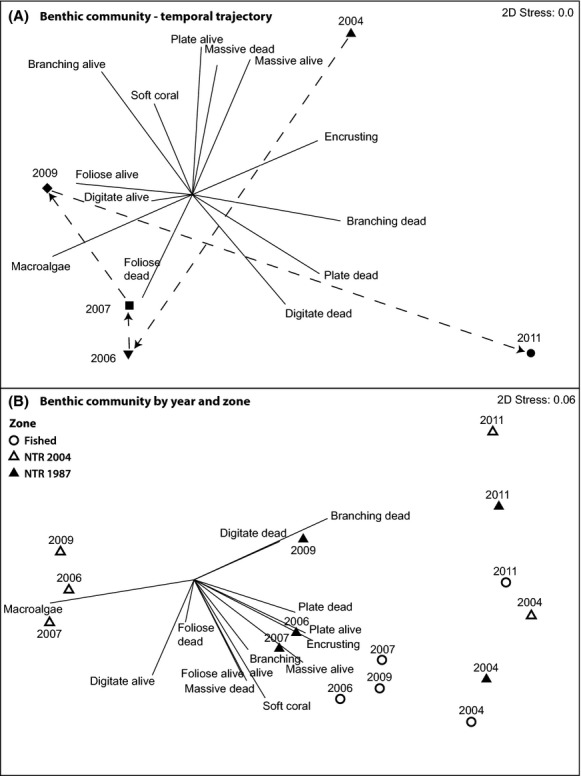
Figure 3.

Nonmetric Multidimensional Scaling (nMDS) biplot on the Bray–Curtis similarity matrix of log (x + 1) transformed benthic community data. (A) nMDS run on annual means for all sites pooled, with temporal trajectory indicated (dashed line). (B) Annual means partitioned by fished zones, old NTRs (NTR 1987), and new NTRs (NTR 2004).
