Figure 5.

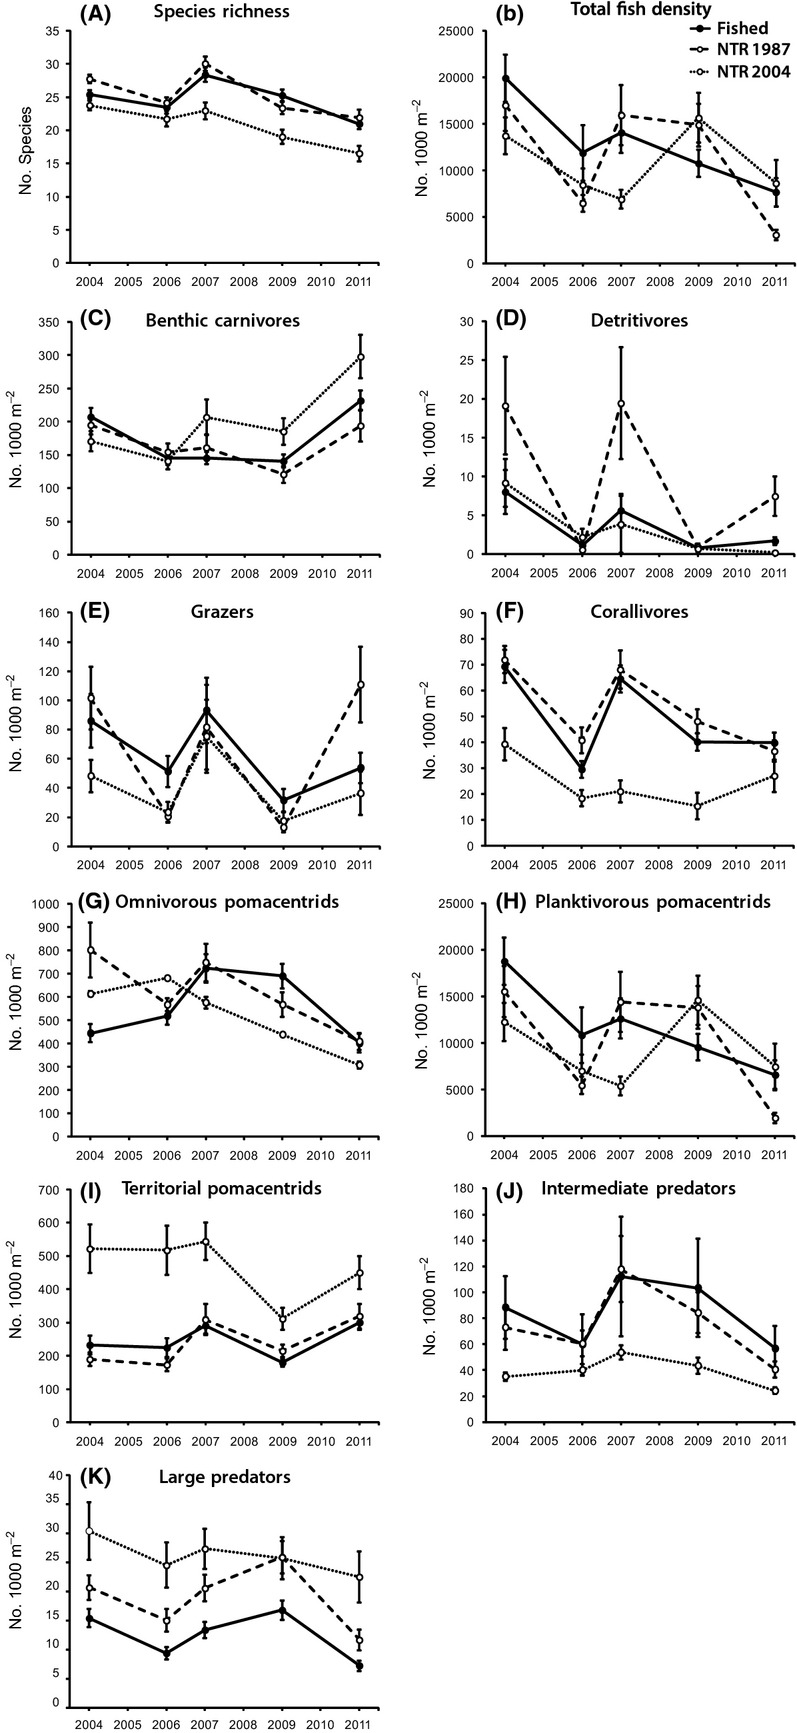
Temporal dynamics in the mean density (individuals 1000 m−2) of major fish functional groups, in fished zones, old NTRs (NTR 1987) and new NTRs (NTR 2004) between 2004 and 2011. Error bars are ±1 SE of the mean.

Temporal dynamics in the mean density (individuals 1000 m−2) of major fish functional groups, in fished zones, old NTRs (NTR 1987) and new NTRs (NTR 2004) between 2004 and 2011. Error bars are ±1 SE of the mean.