
Figure 4.
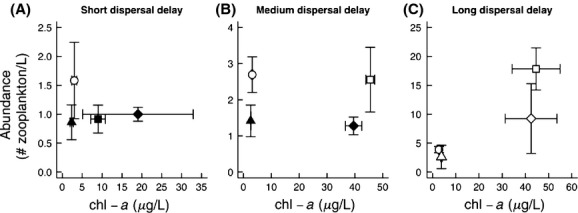
The chl-a concentration (resource supply) and zooplankton abundance (resource uptake) for each treatment on the day dispersers were added for the (A) short-delay, (B) medium-delay, and (C) long-delay treatments. Circles represent control enclosures, squares represent +nutrient enclosures, triangles represent +salt enclosures, and diamonds represent salt+nutrient enclosures. Filled symbols are more invasible than the control, as determined by one-way ANOVAs (Fig. 1). The error bars represent standard error. Note different scales on the y-axis for each panel.