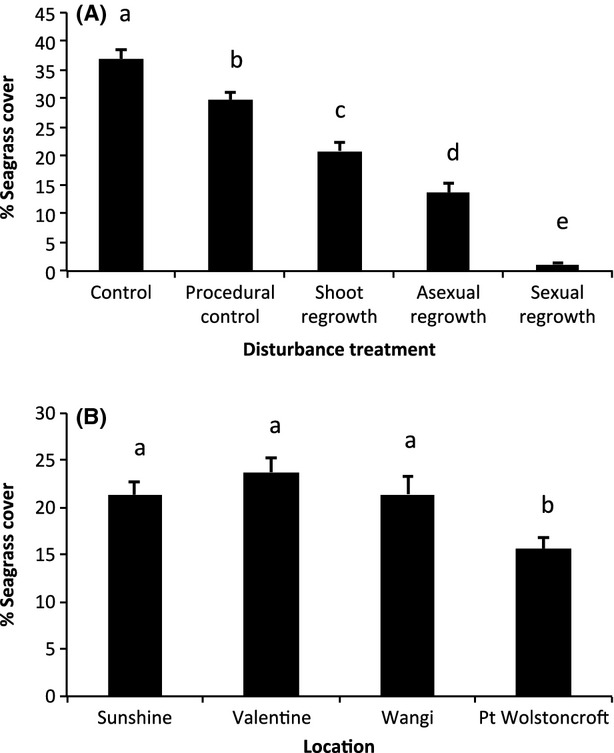
Figure 3.

Differences in seagrass percent cover. Differences in the % seagrass (mean ± SE) cover among (A) disturbance treatment (n = 140; location and time since disturbance pooled) and (B) locations (n = 175; disturbance treatment and time since disturbance pooled). Post hoc SNK tests were used to determine which disturbance treatments and locations differed from each other; bars that have same letters above are not significantly different (P > 0.05).
