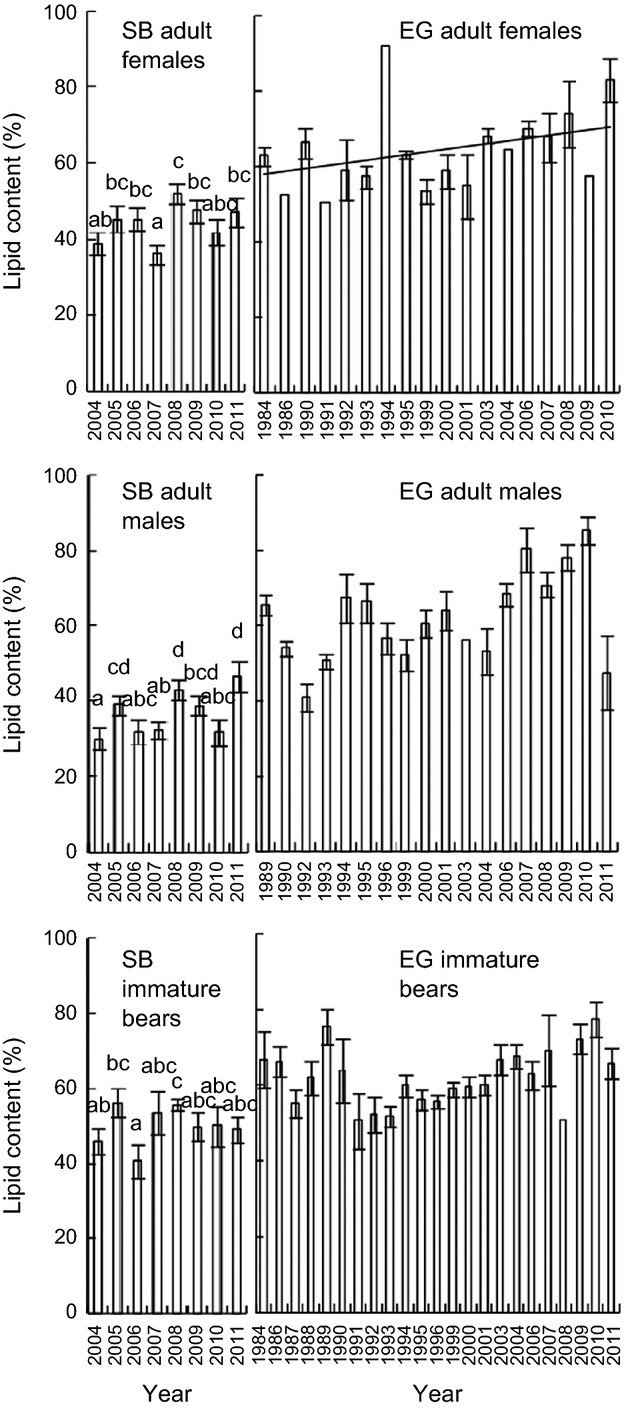
Figure 1.

Adipose lipid content (±SE) of adult female, adult male and immature polar bears sampled in the Southern Beaufort Sea (SB; 2004–2011) and East Greenland (EG; 1984–2011) subpopulations. Different letters indicate significant differences in SB lipid content. Trendlines indicate significant linear trends.
